Structure of the Rwandan Economy
Senior 6 · Economics
Structure of the Rwandan Economy
Lesson 1 of 4
25 min
Follow a sack of maize from a hillside farm to a city table. A farmer grows and harvests it. A mill in a district town turns it into flour and packs it. A lorry carries the flour to Kigali, where a shop sells it and a bank lends the shop its stock money. Behind them all, plant breeders develop better seed, a software firm runs the mobile-money platform the buyer pays with, and agronomists advise the farmer.
Each of these jobs belongs to a different sector of the economy. Think: which of them adds the most value to the sack, and which employs the most people? Are they the same?
Definition
Primary sector: activities that take resources directly from nature: crop and livestock farming, forestry, fishing, mining and quarrying.
Secondary sector: activities that transform raw materials into goods or structures: manufacturing, construction, and electricity and water supply.
Tertiary sector: activities that provide services: trade, transport, hotels and restaurants, real estate, public administration, education and health.
Quaternary sector: knowledge-based services, such as information and communication technology, research, finance and professional and technical consultancy. It is a part of services that some economists separate out.
NISR publishes GDP in three broad groups: agriculture, industry and services. In the second quarter of 2026, GDP at current prices was Frw 7,174 billion, of which services contributed 51%, industry 23%, agriculture 21% and net taxes on products 5% (NISR, GDP National Accounts, Q2 2026). The three-sector model of this lesson groups activities slightly differently: mining belongs to industry in NISR's tables but to the primary sector in the model.
| Sector (model) | NISR activities included | Share of GDP, 2025 | Share of GDP, Q2 2026 |
|---|---|---|---|
| Primary | Agriculture, forestry and fishing; mining and quarrying | 22.2% | 24.3% |
| Secondary | Manufacturing; electricity; water and waste; construction | 20.2% | 19.8% |
| Tertiary | Trade, transport, hotels, real estate, administration, education, health and other services | 44.8% | 42.9% |
| Quaternary | Information and communication; financial services; professional, scientific and technical activities | 7.6% | 7.6% |
| Taxes less subsidies on products | (not a sector) | 5.3% | 5.4% |
Calculated by Ganzaa from NISR's tables of GDP by kind of activity at current prices (NISR, GDP Q2 2026 Tables, Table 1). Quarterly shares move with the farming seasons, so compare a quarter with the same quarter of another year, or use annual figures.
NISR's Labour Force Survey gives the other side. In 2025, of 4,773,000 employed people, 39.1% worked in agriculture, forestry and fishing, 16.5% in industry and 44.4% in services (NISR, LFS 2025, pp. 29 and 33). Regrouped into the four sectors, using the survey's table by activity (Table 4.4, p. 32), the chart compares output with employment.
Worked example 1: regrouping NISR's figures
In Q2 2026 (Frw billion, current prices): agriculture 1,530; mining 210; manufacturing 576; electricity 60; water 21; construction 763; all services 3,623, of which information and communication 145, finance 182 and professional services 221; GDP 7,174 (NISR). Find the shares of the primary and quaternary sectors.
Primary: , and .
Quaternary: , and .
Tertiary (the rest of services): , or about 42.9%.
Note. NISR reports agriculture at 21% and industry at 23%; moving mining from industry to the primary sector raises the primary share to 24.3%. Always say which classification you are using.
Worked example 2: output per worker in each sector, 2025
In 2025, value added was Frw 5,185 billion in the primary sector and Frw 1,771 billion in the quaternary sector (NISR). Of 4,773,000 employed people, 40.9% worked in the primary sector and 2.0% in the quaternary sector (LFS 2025). Compare output per worker.
Primary workers: . Output per worker Frw 2.66 million a year.
Quaternary workers: . Output per worker Frw 18.6 million a year.
Comparison. Using the same method, the secondary sector gives about Frw 6.7 million and the rest of the tertiary sector about Frw 5.2 million per worker. A quaternary worker produced about seven times as much as a primary worker. Two cautions: the survey does not count people who farm only for their own food, while GDP does include that food, so primary output per worker is overstated; and real estate's large value added (including rents that owners "pay" themselves) raises the tertiary figure.
Colin Clark (The Conditions of Economic Progress, 1940) and A. G. B. Fisher observed that, as countries grow richer, labour moves out of the primary sector into the secondary and then the tertiary sector. Rwanda shows the first part of this shift: agriculture's share of employment fell from 47.7% in 2021 to 39.1% in 2025 (LFS 2025, Table 4.4). But most workers leaving farming have gone into trade, transport and other services rather than factories: manufacturing employed only 5.6% in 2025. Dani Rodrik ("Premature deindustrialization", Journal of Economic Growth, 2016) argued that many developing countries now reach their peak of manufacturing at lower incomes than early industrialisers did, so services, often low-productivity informal services, absorb the workers instead.

Warning
A small share of employment is not a small sector. The quaternary sector employs only about 2% of workers, but produces 7.6% of GDP. Always compare output shares with employment shares before judging a sector's importance.
Check the classification. "Industry" in NISR's tables includes mining; the "secondary sector" in the model does not.
Tip
Extract, make, serve, know: primary extracts, secondary makes, tertiary serves, quaternary knows. Use the sack of maize to place any job in its sector.
Important
In 2025 Rwanda's services (tertiary and quaternary) produced over half of GDP and employed about 44% of workers, while the primary sector produced about 22% of GDP but employed about 41% (NISR). Output per worker is lowest in the primary sector and highest in the quaternary sector. Labour is leaving farming, but mostly for services rather than manufacturing.
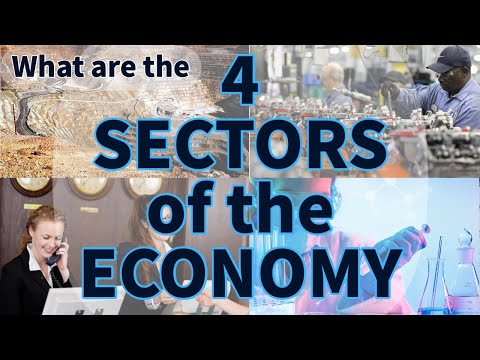
Think Econ, "The 4 Sectors of the Economy". As you watch, list one Rwandan example of each sector, and note which sector the video says grows as countries develop.
Practice
Sources and credits
Written by Ganzaa: the text, the chart, the tables, the worked examples and the practice items. The maize story in the opening case is illustrative. The photo is shared under CC BY-SA 2.0.