Two-Variable Statistics
Senior 6 · Basic Mathematics
Two-Variable Statistics
Lesson 1 of 4
25 min
A Basic Mathematics teacher in Huye asked eight students in her class two things: how many hours they had revised in the week before a test, and what mark they then scored. Every student gives a pair of numbers. The question she wants answered is not about revision alone or marks alone, but about how the two move together.
| Student | A | B | C | D | E | F | G | H |
|---|---|---|---|---|---|---|---|---|
| Revision time, (hours) | 2 | 3 | 4 | 5 | 6 | 7 | 8 | 9 |
| Test mark, (%) | 35 | 42 | 40 | 55 | 58 | 62 | 70 | 75 |
Illustrative data, made up for this lesson.
In earlier years you summarised one variable at a time with a mean, a median and a standard deviation. This unit studies two variables measured on the same individuals.
Definition
Bivariate data is a set of ordered pairs , , where both values are measured on the same individual or occasion.
The independent (explanatory) variable is the one we think may explain or predict the other. The dependent (response) variable is the one we want to predict.
Example: for student A the pair is : 2 hours of revision and a mark of 35%.
A scatter diagram (scatter plot) shows each pair as one point on a coordinate grid.
The points rise from the bottom left to the top right and lie close to a straight line. Students who revised longer tended to score higher.
Definition
Correlation is the relationship between two variables in bivariate data: how strongly, and in which direction, one changes as the other changes.
Example: the revision data show a strong positive correlation.
A full description of a scatter diagram gives three things: the direction (positive or negative), the form (linear, if the points follow a straight line, or non-linear, if they follow a curve) and the strength (strong if the points lie close to the line or curve, weak if they are widely spread).
| Pattern of points | Description |
|---|---|
| All points exactly on a rising straight line | Perfect positive linear correlation |
| Points close to a rising line | Strong positive linear correlation |
| Points loosely around a falling line | Weak negative linear correlation |
| Points spread with no trend | No (zero) correlation |
| Points close to a curve | Non-linear relationship; a straight-line measure does not describe it well |
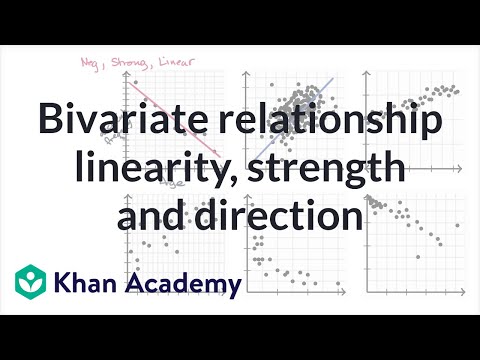
Khan Academy: describing a bivariate relationship by its direction, form (linearity) and strength. Watch how the same three words are used for every scatter plot.
Worked example
Worked example 1. A tomato seller at Nyabugogo market recorded the price per kilogram (Frw) and the mass sold (kg) on five days (illustrative): , , , , . Describe the correlation.
Solution. Price is the independent variable, so it goes on the horizontal axis. As rises by 100 Frw each time, falls: 50, 44, 35, 30, 22. The falls are 6, 9, 5 and 8 kg, roughly equal, so the points lie close to a falling straight line.
The data show a strong negative linear correlation: the higher the price, the less was sold.
Worked example
Worked example 2. For ten adults a researcher records height (cm) and the last digit of their phone number. Predict the scatter diagram and explain.
Solution. The last digit of a phone number is assigned with no regard to the owner's body, so there is no reason for it to rise or fall with height. The points should be scattered with no trend: no correlation. If a small sample happened to show a slight trend, that would be chance, not a relationship.
Warning
Two common mistakes
Tip
Cover the diagram with a pencil laid along the points. If the pencil slopes up, the correlation is positive; if down, negative. If the points hug the pencil, it is strong; if you could turn the pencil in any direction, there is no correlation.
Practice
Important
Describe every scatter diagram by direction, form and strength. Correlation measures association, not cause.
Sources and credits
Text, data, diagrams and exercises: Written by Ganzaa. All data are illustrative.
Video: Bivariate relationship linearity, strength and direction, Khan Academy, embedded from YouTube.