Cosmology, Galaxies and Expansion of the Universe
Senior 6 · Physics
Cosmology, Galaxies and Expansion of the Universe
Lesson 2 of 5
25 min
Look at the stars of Orion on a clear night: Betelgeuse, at the hunter's shoulder, is distinctly orange, while Rigel, at his knee, is blue-white. No one has visited a star, and no probe will reach one for thousands of years. Everything we know about them, their temperature, size, power, composition and motion, comes from their light. This lesson starts with the star we know best, the Sun, and develops the tools for reading any star: luminosity and brightness, the black-body laws, the magnitude scale and spectral classes.
The Sun is a ball of hot gas, mostly hydrogen and helium, held together by its own gravity and powered by nuclear fusion in its core (Unit 5). Its visible surface, the photosphere, radiates almost like a black body. The International Astronomical Union's nominal values (2015) are: luminosity , radius and effective surface temperature 5772 K. Its mass is .

A star's luminosity is the total power it radiates, in watts. What we measure on Earth is its brightness (radiant flux density) , the power received per unit area at right angles to the light. The power spreads over a sphere of area , so
A dim star may be powerful but far away. To know we need (measured) and (Lesson 3).
A star's spectrum is close to that of a black body at its surface temperature (Figure 2.1). Two laws describe it.
Figure 2.1: Black-body spectra. If drawn to the same scale, the 10 000 K curve would be about 67 times higher than the 3500 K curve per unit area, because emission grows as .
Definition
The luminosity of a star is the total power it emits as electromagnetic radiation (unit W). Its brightness (flux density) at a distance is the power received per unit area, (unit ). Example: the Sun's brightness at the Earth, the solar constant, is about .
Worked example 1: the Sun's luminosity and temperature
(a) The solar constant is at . Find the Sun's luminosity. (b) Using , find its surface temperature. (c) Find the peak wavelength of its spectrum.
Solution
(a) .
(b) .
(c) , in the blue-green; the eye sees the mixture of all visible wavelengths as white.
Worked example 2: how big is a red supergiant?
Betelgeuse has a surface temperature of about 3600 K and a luminosity of about (estimates vary). (a) Find its peak wavelength. (b) Find its radius in units of the Sun's radius.
Solution
(a) , in the near infrared: the visible part of its light is dominated by red and orange.
(b) Dividing for the two stars: . Placed where the Sun is, Betelgeuse would reach beyond the orbit of Mars.
About 2100 years ago the Greek astronomer Hipparchus ranked the stars from first magnitude (brightest) to sixth (faintest visible). The modern scale keeps this backwards ordering but makes it exact: a difference of 5 magnitudes is defined as a brightness ratio of exactly 100. One magnitude is therefore a factor of :
The apparent magnitude describes how bright a star looks from Earth: Sun −26.74, Sirius −1.46 (the brightest star at night), Vega 0.03, faintest stars visible to the eye in a dark sky about +6. The absolute magnitude is the apparent magnitude the star would have at a standard distance of 10 pc; it measures luminosity, and is used in Lesson 3.
Worked example 3: comparing brightnesses
(a) How many times brighter does the Sun () appear than Sirius ()? (b) A star appears 40 times fainter than Vega (). What is its apparent magnitude?
Solution
(a) .
(b) , so (to 2 s.f.). Fainter stars have larger magnitudes.
Passed through a spectrometer, starlight shows a continuous spectrum crossed by dark absorption lines, produced by atoms and ions in the cooler outer layers absorbing particular wavelengths. Which lines are strong depends mainly on the temperature, not on the composition, which is similar for most stars (about three-quarters hydrogen and a quarter helium by mass). Stars are sorted into seven main spectral classes, each divided into subclasses 0 to 9; the Sun is G2.
| Class | Surface temperature / K | Colour | Strongest lines | Example |
|---|---|---|---|---|
| O | above 30 000 | blue | ionised helium | stars of Orion's Belt (O and B) |
| B | 10 000 to 30 000 | blue-white | neutral helium, hydrogen | Rigel |
| A | 7500 to 10 000 | white | hydrogen (strongest of all) | Sirius, Vega |
| F | 6000 to 7500 | yellow-white | hydrogen, ionised calcium | Procyon |
| G | 5200 to 6000 | yellow | ionised calcium, metals | the Sun |
| K | 3700 to 5200 | orange | neutral metals | Arcturus |
| M | below 3700 | red | molecules such as titanium oxide | Betelgeuse, Proxima Centauri |
The hydrogen lines in visible light (the Balmer series) come from atoms whose electron starts in the second energy level. In cool stars few atoms are excited that far; in the hottest, most hydrogen is ionised. So the hydrogen lines are strongest in between, at about 10 000 K, in class A. The order was worked out in 1901 by Annie Jump Cannon, who classified more than 300 000 stars.
Definition
A star's spectral class is a letter (O, B, A, F, G, K, M, from hottest to coolest) given according to the pattern of absorption lines in its spectrum, which depends mainly on its surface temperature. Example: Vega's very strong hydrogen lines make it class A0, with a surface temperature of about 9600 K.
Warning
Common mistakes. (1) Confusing luminosity (power emitted, W) with brightness (power received per square metre, ). (2) Forgetting that larger magnitudes mean fainter stars, and that the scale is logarithmic: 5 magnitudes is a factor of 100, not 5. (3) Using °C in Wien's or Stefan's law: temperatures must be in kelvin. (4) Thinking different spectral classes mean different compositions: mainly they mean different temperatures.
Tip
The class order O B A F G K M is remembered by the phrase "Oh Be A Fine Guy (or Girl), Kiss Me", hottest first. For any star question, link the three formulas: , , .
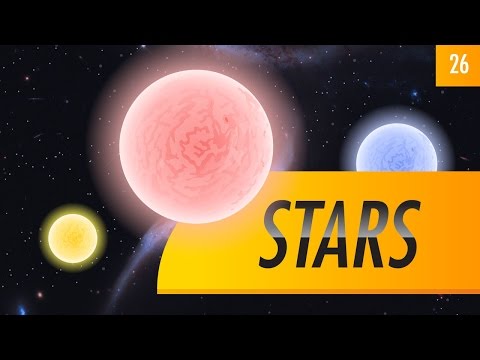
Stars: Crash Course Astronomy #26, presented by Phil Plait. Watch for the spectral classes, why the hydrogen lines peak in A stars, and how colour reveals temperature.
Practice
Key points
Sources and credits
The diagram, the worked examples and the practice exercises are written by Ganzaa.