Climate Change
Senior 6 · Geography
Climate Change
Lesson 1 of 4
25 min
The two satellite views below show the summit of Kilimanjaro, Africa's highest mountain, seven years apart. Look first at the centre of each frame, where the white cover sits, and then at the slopes in the middle ground around it. A geographer's first question is not "what happened?" but "is this a real trend, or just a difference between two days?" A single pair of dates can mislead: a recent snowfall can whiten a summit for a week. That is why climate is studied through long series of measurements, and why this lesson begins by separating weather from climate.

Definition
Weather: the state of the atmosphere at a place over hours or days (temperature, rainfall, wind, cloud).
Climate: the average weather of a place and its usual variability, normally calculated over 30 years. Example: Kigali's climate is described from 30 years of records, not from one wet April.
Climate change: a change in the state of the climate that can be identified by changes in the average or the variability of its properties, and that lasts for decades or longer (IPCC definition). The United Nations Framework Convention on Climate Change (UNFCCC) uses the term only for change caused directly or indirectly by human activity, on top of natural variability.
Climate variability: short-term ups and downs around the average, such as a dry year caused by El Niño, which do not by themselves make a long-term change.
The Intergovernmental Panel on Climate Change (IPCC) does no research of its own; it assesses thousands of published studies. Its Sixth Assessment Report (AR6, Working Group I, 2021) concluded that "it is unequivocal that human influence has warmed the atmosphere, ocean and land". The main lines of evidence are summarised below.
| Indicator | Observed change | Source |
|---|---|---|
| Global surface temperature | 1.09 °C higher in 2011–2020 than in 1850–1900 (likely range 0.95–1.20 °C) | IPCC AR6 WGI, 2021 |
| Global mean sea level | Rose by about 0.20 m between 1901 and 2018; the rate grew from 1.3 mm per year (1901–1971) to 3.7 mm per year (2006–2018) | IPCC AR6 WGI, 2021 |
| Carbon dioxide (CO₂) in the air | 315.98 ppm in 1959, 424.61 ppm in 2024 and 427.35 ppm in 2025 (annual means at Mauna Loa, Hawaii) | NOAA Global Monitoring Laboratory, 2026 |
| CO₂ in context | Higher in 2019 than at any time in at least 2 million years | IPCC AR6 WGI, 2021 |
| Ice | Glaciers are retreating almost everywhere in the world, including on Kilimanjaro, Mount Kenya and the Rwenzori | IPCC AR6 WGI, 2021 |
Worked example 1: checking the sea-level figures
Problem. Use the three IPCC rates to estimate the total rise from 1901 to 2018, and compare it with the IPCC total of 0.20 m.
Solution. Multiply each rate by the length of its period:
(The middle rate, 1.9 mm per year, is the IPCC figure for 1971–2006.) The estimate agrees with the IPCC total. Notice also that the latest rate is times the early one: sea level is not only rising, it is rising faster.
Worked example 2: how fast is CO₂ rising?
Problem. Using NOAA's Mauna Loa means, find the average yearly rise in CO₂ from 1959 to 2024, and the rise from 2024 to 2025.
Solution.
The recent yearly rise is well above the long-run average, so the build-up is accelerating, not levelling off.
The climate has always changed. The question for any period is which drivers explain the change seen.
| Natural causes | How they act | Time scale |
|---|---|---|
| Changes in the Earth's orbit and tilt (Milankovitch cycles) | Alter how much sunlight reaches each latitude and season; they pace the ice ages | Tens of thousands of years |
| Changes in the Sun's output | Small rises and falls in solar energy, such as the 11-year sunspot cycle | Years to centuries |
| Large volcanic eruptions | Sulphate particles in the stratosphere reflect sunlight and cool the surface briefly | One to three years |
| Ocean–atmosphere cycles (El Niño and La Niña) | Move heat between the ocean and the air, giving warm or cool, wet or dry years | Months to years |
| Plate movements | Shift continents and ocean gateways, and build mountains that change air flow | Millions of years |
None of these explains the warming since 1850: the Sun's output has not risen over recent decades, and volcanoes cool rather than warm. The IPCC attributes the warming to human activities that add greenhouse gases to the air, mainly carbon dioxide (CO₂), methane (CH₄) and nitrous oxide (N₂O). How these gases trap heat is the subject of the next lesson.
Figure 1: where the world's greenhouse gases came from in 2019. Blue bars are mainly fossil-fuel burning; the red bar is land use, chiefly deforestation, livestock and fertiliser.
Warning
Common mistakes
| Scale | Effects observed or projected |
|---|---|
| Global | More frequent and intense heatwaves and heavy rainfall; longer droughts in some regions; sea-level rise that floods low coasts and salts farmland; ocean warming and acidification that bleach coral reefs; melting glaciers and sea ice; plants and animals shifting towards the poles and uphill |
| Africa | The IPCC (AR6 WGII, 2022) finds that Africa has contributed among the least to the gases that cause climate change, yet is among the most vulnerable. It estimates that climate change has reduced agricultural productivity growth in Africa by 34% since 1961, more than in any other region. Recurrent drought in the Sahel and the Horn of Africa, shrinking glaciers on East Africa's mountains, and coastal flooding in cities such as Lagos and Alexandria are all linked to a warming climate |
| Rwanda | Rwanda's Green Growth and Climate Resilience Strategy (Republic of Rwanda, 2011) reports a temperature rise of about 1.4 °C since 1970, faster than the global average. Steep hills and heavy rain make floods and landslides the most damaging hazards: in early May 2023 floods and landslides in the Western and Northern Provinces killed more than 130 people (MINEMA, 2023). Rain-fed farming, hydropower and the tea and coffee crops all depend on reliable seasons |
Rwanda's emissions per person are tiny on a world scale, yet its exposure is high for three geographical reasons. First, relief: on steep slopes, intense rain quickly becomes runoff, so soil erosion, landslides and flash floods follow. Second, economy: most households farm, and most farming depends on rain arriving in the two rainy seasons. Third, density: with people living on almost every hill, there is little unused land to move to. Exposure, not emissions, decides where the damage falls.
"The countries that suffer most from climate change caused it least." Using Africa and Rwanda as examples, how far do you agree? What would fairness require of the largest emitters?
Tip
Exam technique. For an "effects" question, organise your answer by scale (global, Africa, Rwanda) or by system (water, farming, health, settlements), and back each point with a place and a figure with its year. "Sea level rose about 0.20 m between 1901 and 2018 (IPCC AR6)" earns more than "sea levels are rising".
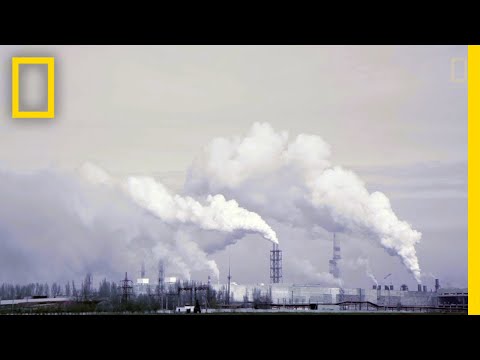
National Geographic: "Causes and Effects of Climate Change". Note which causes the film treats as human and which as natural, and compare its list of effects with the table above.
Practice
Summary
Sources and credits
Photo: Kilimanjaro glacier retreat (NASA, public domain), via Wikimedia Commons.
Video: "Causes and Effects of Climate Change", National Geographic, embedded from YouTube.
Figure 1, the worked examples and the exercises were drawn and written by Ganzaa. Written by Ganzaa.