Random Variables
Senior 6 · Mathematics
Random Variables
Lesson 5 of 5
40 min
Measure the heights of many pupils of the same age, the masses of many bags filled by one machine, or the errors of many careful measurements of the same length, and draw a histogram. Again and again the same shape appears: high in the middle, symmetric, falling away smoothly on both sides. The curve that fits it is the normal (or Gaussian) distribution, studied by Abraham de Moivre in the 1730s and by Carl Friedrich Gauss in his work on errors of measurement. It also appears whenever many small independent effects add up, which is the content of the central limit theorem, and it approximates the binomial distribution when is large.
Definition
A continuous random variable has the normal distribution with mean and variance (), written , if its density is
Then and . The case , is the standard normal distribution; its variable is called and its cdf . Example: if pupils' heights follow in cm, the mean is 165 cm and the standard deviation 8 cm.
Important
Properties of the normal curve. It is bell-shaped and symmetric about , where it is highest; it has points of inflection at ; it approaches the -axis on both sides without touching it; the total area under it is 1.
Standardising. If , then
By symmetry, . The integral of has no formula in elementary functions, so is read from tables or computed by a calculator.
Some values of , to 4 decimal places:
| 0 | 0.5 | 1 | 1.25 | 1.5 | 1.645 | 1.9 | 1.96 | 2 | 2.5 | 3 | |
|---|---|---|---|---|---|---|---|---|---|---|---|
| 0.5000 | 0.6915 | 0.8413 | 0.8944 | 0.9332 | 0.9500 | 0.9713 | 0.9750 | 0.9772 | 0.9938 | 0.9987 |
The 68–95–99.7 rule follows: , and similarly 0.954 for and 0.997 for .
Worked example 1: probabilities by standardising
In an illustrative model, the heights of S6 pupils follow in cm. Find the proportion of pupils (a) shorter than 175 cm; (b) between 155 cm and 175 cm.
Solution. (a) , so : about 89%.
(b) For 155 cm, . : about 79%.
Worked example 2: working backwards
(a) With the heights of worked example 1, find the height below which 90% of pupils lie. (b) In an illustrative exam, 10% of candidates score below 40 and 5% above 80. Assuming the marks are normal, find and .
Solution. (a) gives , so cm.
(b) gives , and gives . So
Subtracting: , so and .
Important
Normal approximation to the binomial. If with and , then is approximately . Because takes whole-number values and the normal variable is continuous, use a continuity correction: the value is treated as the interval from to . For example, and .
Worked example 3: 100 tosses of a coin
A fair coin is tossed 100 times. Estimate the probability of at least 60 heads.
Solution. : , , .
The exact binomial value is 0.0284. Without the correction, , noticeably worse.
Warning
Divide by , not by . In the second number is the variance; the standard deviation is 8.
Draw a sketch before using the table. Tables give the area to the LEFT of . For "more than", subtract from 1; for a negative , use . A sketch shows at once whether the answer should be more or less than 0.5.
Tip
Remember three numbers: about 68% of values lie within of the mean, 95% within (more exactly ) and 99.7% within . They give a quick check of any normal calculation, and a value more than from the mean is rare enough to be worth checking.
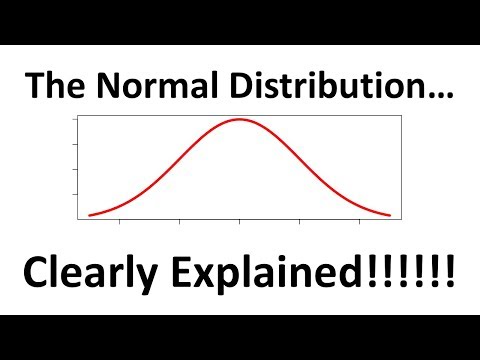
StatQuest with Josh Starmer: The Normal Distribution, Clearly Explained!!! (about 5 min). Watch how the mean sets the centre of the curve and the standard deviation sets its width, and where the 95% of values lie.
Practice
Questions 1 to 3 are routine; 4 to 6 need more care; 7 asks for a proof.
Further reading for this unit
Sources and credits