Demand and Supply Analysis
Senior 4 · Economics
Demand and Supply Analysis
Lesson 4 of 5
30 min
NISR's national accounts report that in 2025 Rwanda's production of export crops rose by 32%, driven by a 60% increase in coffee production and an 8% increase in tea; food crop production rose by 3%. Farmers are sellers: how much they bring to market depends on the price they expect, but also on rain, fertiliser, the age of their trees and much else. This lesson does for sellers what the last two lessons did for buyers: it defines supply, states the law of supply, and separates a movement along the supply curve from a shift of the whole curve.

Definition
Supply: the quantity of a good that producers are willing and able to offer for sale at each possible price, over a given period, ceteris paribus.
Quantity supplied: the amount offered at one particular price.
Stock is different: it is the total amount of a good in existence, part of which may be held back from sale.
| Type | Meaning | Example |
|---|---|---|
| Individual and market supply | One producer's supply; the total of all producers' supply at each price | One farmer's tomatoes; all tomato farmers in a district |
| Joint supply | Producing one good automatically produces another | Beef and hides; milk and cream |
| Competitive supply | Resources used for one good cannot be used for another | A hillside planted with tea or with maize |
| Composite supply | A good supplied from several different sources | Electricity from hydro dams, methane gas and solar panels |
Definition
The law of supply: ceteris paribus, the higher the price of a good, the greater the quantity supplied, and the lower the price, the smaller the quantity supplied. Price and quantity supplied are directly (positively) related.
Ten tomato farmers in a district each have the same supply schedule. Market supply is ten times one farmer's supply at each price (illustrative figures).
| Point | Price (Frw per kg) | One farmer (kg per day) | Market, 10 farmers (kg per day) |
|---|---|---|---|
| v | 100 | 20 | 200 |
| w | 200 | 60 | 600 |
| x | 300 | 100 | 1,000 |
| y | 400 | 140 | 1,400 |
| z | 500 | 180 | 1,800 |
Why the supply curve slopes upwards.
Worked example 1: the supply function
One farmer's schedule fits the straight line , and the market's .
(a) Slope of the market curve between w and x:
Positive: the curve slopes upwards. Each extra 4 kg needs the price to rise by Frw 1.
(b) Quantity supplied at Frw 350: kg a day.
(c) The lowest price at which anything is offered: set : , so . Below Frw 50 per kg it does not pay farmers to bring tomatoes to market at all.
| Determinant | Change | Effect on the supply curve |
|---|---|---|
| Costs of production | Fertiliser, fuel or wages become dearer | Shifts left |
| Technology | Better seed, irrigation, machines | Shifts right |
| Prices of other goods | Maize becomes more profitable than beans (competitive supply) | Supply of beans shifts left |
| Joint products | More cattle slaughtered for beef | Supply of hides shifts right |
| Number of producers | New farmers or firms enter | Shifts right |
| Weather and natural factors | Good rains; or drought, floods, pests | Right; or left |
| Government policy | Taxes on producers; subsidies; regulations | Tax: left. Subsidy: right. Strict regulation: left |
| Expectations | Sellers expect higher prices soon | Shifts left now (stock held back) |
| Time and gestation period | A coffee tree takes years to bear fruit | Supply responds slowly to price |
| Infrastructure and security | Better feeder roads to markets | Shifts right |
Definition
Change in quantity supplied: a movement along the supply curve caused only by a change in the good's own price: an extension (more) or a contraction (less) of supply.
Change in supply: a shift of the whole supply curve caused by any other determinant: an increase (right) or a decrease (left).
Worked example 2: a subsidy and a tax shift supply (illustrative)
A fertiliser subsidy cuts one farmer's cost by Frw 50 for every kilogram. She now needs Frw 50 less per kilogram to offer the same amount, so in her supply function is replaced by :
At Frw 300 she now offers kg instead of 100 kg. Seen vertically, the 100 kg she used to offer at Frw 300 is now offered at Frw 250: the curve has moved down by exactly the Frw 50 subsidy.
A tax of Frw 50 per kg does the reverse: , only 80 kg at Frw 300.
Warning
"Supply rose because the price rose" mixes two ideas. A higher price raises the quantity supplied along the curve. "Supply" rises only when the curve shifts, through lower costs, better technology, good weather or more producers. Be especially careful with farm output: was NISR's 60% rise in coffee production in 2025 a response to price, or a shift caused by the harvest itself? Coffee trees take years to mature, so most of a single year's jump in output comes from weather and the cycle of the trees, not from a price response.
Tip
Supply shifts: "costs up, curve left". Anything that makes producing dearer (taxes, dearer inputs, bad weather) shifts supply left; anything that makes it cheaper (subsidies, technology, good rains) shifts it right.
Important
Discuss. Many Rwandan farmers grow food both to eat and to sell. How might this affect the shape of their supply curve for beans? Think about a household that sells only what is left after feeding the family, and about the target-income seller.
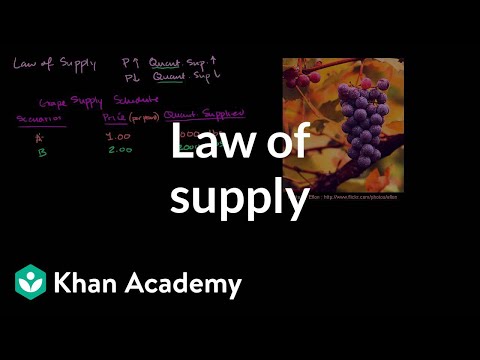
Khan Academy, "Law of supply". Watch for the reasons a higher price leads producers to offer more, then compare them with the list in section 2.
Practice
Key points
Sources and credits
Written by Ganzaa: the text, the supply diagrams (drawn to scale from their equations), the tables, the worked examples and the practice items. The tomato schedules, subsidy and tax figures are illustrative. The photo is shared under CC BY-SA 4.0.
Quick check