Descriptive Statistics
Senior 4 · Basic Mathematics
Descriptive Statistics
Lesson 4 of 5
25 min
Two mills sell maize flour in 5 kg bags. An inspector weighs 8 bags from each. Mill A: 4.98, 5.02, 5.00, 4.97, 5.03, 5.01, 4.99, 5.00 kg. Mill B: 4.80, 5.20, 5.05, 4.90, 5.15, 4.85, 5.10, 4.95 kg. (Illustrative data.) Both means are exactly 5.00 kg, yet customers of Mill B complain that some bags are 200 g short. An average alone cannot show this. We also need a measure of spread (dispersion): how far the values lie from the centre and from each other.
Definition
Range largest value smallest value. Quartiles divide ordered data into four equal parts; is the median. Interquartile range , the spread of the middle half; quartile deviation .
Variance : the mean of the squared deviations from the mean. Standard deviation , in the same units as the data:
Ungrouped data (in order): is at position and at position ; when a position is not a whole number, interpolate between the two neighbouring values. (Calculators and software sometimes use slightly different rules, which give slightly different answers.)
Grouped data: as for the median, interpolate inside the class that contains the th or th value:
Graphically, draw the cumulative frequency curve (ogive), plotting each cumulative frequency at its class's upper boundary, and read across from , and .
Minimum, , median, and maximum summarise a distribution; a box plot draws them. A value more than beyond a quartile is usually treated as an outlier and plotted on its own.
The box (the middle half of the districts) is narrow and sits to the left; the right whisker is long and Gasabo lies beyond the fence. Box plots show skew and outliers at a glance and make it easy to compare groups side by side.
Tip
Pair the measures. Report the median with the IQR (both resist outliers), and the mean with the standard deviation (both use every value). For skewed data with outliers, such as district populations or incomes, the median and IQR describe a typical member better.
Worked example 1: the two mills
Find the range and the standard deviation for each mill (both means are 5.00 kg).
| Mill B: | 4.80 | 5.20 | 5.05 | 4.90 | 5.15 | 4.85 | 5.10 | 4.95 | Sum |
|---|---|---|---|---|---|---|---|---|---|
| −0.20 | 0.20 | 0.05 | −0.10 | 0.15 | −0.15 | 0.10 | −0.05 | 0 | |
| 0.0400 | 0.0400 | 0.0025 | 0.0100 | 0.0225 | 0.0225 | 0.0100 | 0.0025 | 0.1500 |
The same working for Mill A gives , and kg. Ranges: A kg; B kg.
Conclusion: Mill B's bags vary about seven times as much (). The deviations always add up to 0, which is why we square them before averaging.
Worked example 2: quartiles and outliers in the census data
For the 30 district populations (in order), is at position and at .
Only Gasabo (879 505) lies above the fence, so it is the one outlier; Nyagatare (653 861) is large but inside. The lower fence, , is below every district.
Worked example 3: standard deviation and quartiles from the grouped table
Using midpoints (thousands) and = 15, 10, 3, 1, 0, 1, with from lesson 3:
Quartiles: lies in the first class, ; lies in , . IQR thousand.
Compare with the exact values from the 30 numbers: thousand and IQR thousand. Grouping loses a little accuracy but keeps the picture.
Warning
Common mistakes. Forgetting the square root (variance is in "thousands squared"; standard deviation is in thousands). Using instead of . Rounding too early in , which can make a small variance badly wrong. Mixing the sample formula (dividing by , used to estimate a population from a sample) with the formula used here (dividing by ): state which you use.
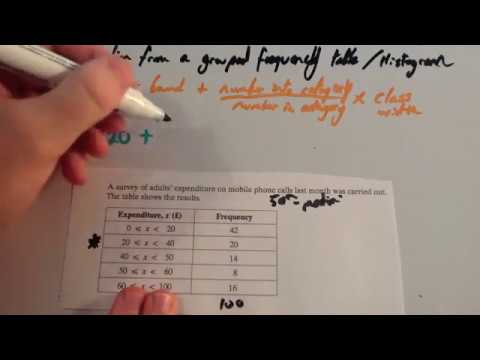
Corbettmaths, "Medians, quartiles from histograms and grouped data". Watch the interpolation method, then check the grouped quartiles 350 and 475 of worked example 3.
Practice
Try each one before opening the answers. They get harder as you go.
Key points
Sources and credits
Quick check