Agriculture in Rwanda
Senior 4 · Geography
Agriculture in Rwanda
Lesson 5 of 5
25 min
In 2025 Rwanda's GDP was Frw 23,387 billion and grew by 9.4%. Services contributed 52%, industry 22% and agriculture 20% (NISR). Figure 5 shows how agriculture's share has changed, and Figure 6 what it is made of.
Figure 5. Agriculture's share of GDP, 2015–2025, calculated by Ganzaa from NISR's GDP tables.
Figure 6. Value added by agriculture, forestry and fishing in 2025. Drawn by Ganzaa from NISR.
Agriculture's value keeps rising (it grew 7% in 2025), but its share of GDP drifts down. How can both be true?
Definition
Gross domestic product (GDP): the total value of goods and services produced in a country in a year. Value added: the value of a sector's output minus the inputs it buys from others.
Structural change: the shift of output and workers from agriculture to industry and services as an economy develops. Food self-sufficiency: the share of a country's food needs met by its own production.
| Contribution | Evidence |
|---|---|
| Output (GDP) | Frw 4,748 billion in 2025, 20.3% of GDP; food crops are more than half of it (NISR) |
| Employment | 39.1% of employed people worked mainly in agriculture, forestry and fishing in 2025 (NISR, LFS) |
| Food security and nutrition | Rwanda produces nearly 83% of its food needs (MINAGRI, 2026); milk about 1.1 million tonnes a year |
| Export earnings | Agricultural exports earned US$893.2 million in 2024–25 (MINAGRI); tea alone US$114.8 million in 2023–24 (NAEB); in 2025 export-crop output rose 32%, with coffee up 60% and tea 8% (NISR) |
| Raw materials for industry | Tea factories, coffee washing stations, sugar, milk and food processing; food processing grew 9% in 2025 (NISR) |
| Land use | About 1.37 million ha, 58% of the country's land (NISR, SAS 2024) |
| Rural incomes and markets | Sales of food, milk and cash crops; a market for fertiliser, seed, tools and transport |
| Government revenue and savings | Taxes on exports and processing; savings from cooperatives |
Worked example 1: how productive is a farm worker?
Data. Agriculture produced 20.3% of GDP (2025) with 39.1% of employed workers (LFS 2025).
Interpretation. On average a worker in agriculture produces only about half as much value as the average worker in the whole economy. This gap explains why farm incomes are low, and why raising yields (lesson 3) and moving some workers into processing and services are both needed. It also explains Figure 5: as other sectors grow faster, agriculture's share falls even while its output rises.

Worked example 2: can export earnings grow fast enough?
Data (MINAGRI, 2026). Agricultural export revenue: US$893.2 million in 2024–25; target US$1.54 billion by 2028–29, four years later.
Evaluation. Earnings must grow by almost 15% a year. 2025 shows it is possible in a good year (export-crop output +32%), but tea output grew 8%. Reaching the target depends on prices, weather, coffee yields and on selling more processed products rather than raw tea and coffee.
Policy response: the Strategic Plan for Agriculture Transformation (PSTA4, MINAGRI) and NST2 (2024–2029) aim for agricultural growth above 6% a year, more irrigation, higher milk output, and larger and more valuable exports (MINAGRI, 2026).
Warning
A falling share is not a falling sector. Agriculture's value added rose from Frw 1,405 billion (2015) to 4,748 billion (2025) at current prices, more than tripling, while its share of GDP fell from 23.1% to 20.3%. Always say whether you mean the amount or the share.
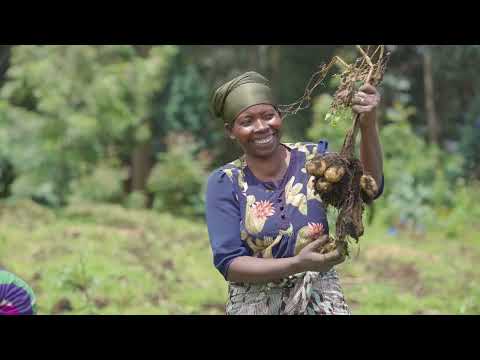
Rwanda Agri: "20 Years of Rwanda's Agricultural Transformation". The changes in farming, exports and livelihoods over two decades. Note two contributions of agriculture that this lesson's data confirm.
Practice
Key points
Further reading
Sources and credits
Sources: GDP National Accounts, 2025, NISR (GDP, sector shares and growth; Figures 5 and 6 from its annual workbook); Labour Force Survey Annual Report 2025, NISR (employment by sector); Seasonal Agricultural Survey 2024, NISR (agricultural land); Rwanda's agriculture sector transformation over the last 32 years, MINAGRI, 2026 (food self-sufficiency, export earnings and targets, milk, NST2); About Rwanda Tea, NAEB; PSTA4, MINAGRI.
Figures 5 and 6 and the worked examples were drawn and written by Ganzaa.
Photo: Banana agriculture in Rwanda, RebeccaRwanda, CC BY-SA 4.0, via Wikimedia Commons.
Video: "20 Years of Rwanda's Agricultural Transformation", Rwanda Agri, embedded from YouTube. The rest of the lesson and the exercises were written by Ganzaa.
This lesson adapts CC BY-SA material and is shared under CC BY-SA 4.0.
Quick check