Database Design
Senior 4 · ICT
Database Design
Lesson 3 of 5
25 min
Nobody builds a house without a plan, and nobody should build a database without one. An entity-relationship diagram (ERD) is that plan: a drawing of the entities, their attributes and the relationships between them, which the people who will use the database can check before a single table exists. A mistake caught on paper costs an eraser; the same mistake caught after a year of data entry costs weeks.
The ER model was published by Peter Chen in 1976 and is still the most common way to teach and plan relational databases. You will meet two notations: Chen notation, good for the first, conceptual sketch, and crow's foot notation, which most design tools use.
Definition
Entity-relationship diagram (ERD): a diagram of the entities in a system, their attributes, and the relationships between them, with their cardinality and participation.
Conceptual model: an ERD that shows what must be stored, in terms the users understand, without deciding tables or data types. Logical model: the same design turned into tables, keys and fields (Lesson 4).
Weak entity: an entity that cannot be identified by its own attributes alone, only together with the entity it depends on: a book Copy numbered 1, 2, 3 within each book. Chen notation draws it with a double rectangle.
| Symbol | Means |
|---|---|
| Rectangle | Entity (double rectangle: weak entity) |
| Diamond | Relationship, named with a verb |
| Oval joined to an entity or relationship | Attribute; underlined for a key, double oval for multi-valued, dashed oval for derived |
| 1, N, M beside the lines | Cardinality |
| Double line | Total (mandatory) participation: every instance must take part |
Notice that DateBorrowed belongs to neither Student nor Book: it is a fact about one particular borrowing. Attributes of an M:N relationship are a sign that the relationship will become a table of its own (Lesson 4).
Crow's foot notation, which goes back to an article by Gordon Everest in 1976, draws each entity as a box with its attributes listed inside and the primary key marked PK. The relationship is a plain line, and the symbols at each end give the minimum and maximum: a bar means one, a circle means zero, and the three-pronged "crow's foot" means many. Read each end at the entity it touches: in the diagram below, the end touching Student says how many students one class has.

You can draw ERDs on paper or with a free tool such as draw.io, which has ready-made ER and crow's-foot shapes.
Worked example 1: a coffee cooperative
"The cooperative records each member's ID, name and village, and each washing station's ID and name. Members deliver coffee cherries to the station of their zone; each delivery records the date and the kilograms delivered. Each member delivers to one station, often several times a season." (A scenario written for this lesson.)
Worked example 2: read a diagram aloud
Take the crow's foot diagram of Class, Student and Book above and say each relationship in two sentences.
If a sentence sounds wrong to the librarian ("a class with zero students? not in our school!"), the diagram is changed now, while it is still cheap to change.
Worked example 3: find the four mistakes
A student's first ERD for a clinic shows: an entity Patient (Name, Phone); an entity Phone number joined to Patient; a relationship diamond labelled Appointment book between Patient and Doctor; and no line ends marked.
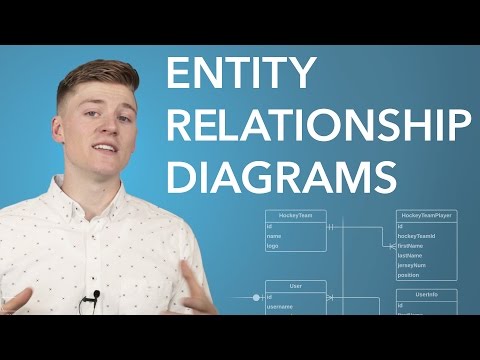
Lucid Software: Entity Relationship Diagram (ERD) Tutorial, Part 1. Watch entities, attributes and relationships being drawn, and how the crow's foot line endings show one, many, zero or one.
Warning
Tip
Nouns are entities, verbs are relationships, adjectives and facts are attributes. Then read every line aloud in both directions: "Each A has … B; each B has … A."
Practice
Key points
Sources and credits
This lesson adapts CC BY-SA material and is shared under CC BY-SA 4.0.
Quick check
Match each Chen symbol to what it shows.
Tap one on the left, then its partner on the right.