Rwanda's Socio-Economic and Demographic Health Indicators
Senior 4 · General and Religious Studies
Rwanda's Socio-Economic and Demographic Health Indicators
Lesson 1 of 4
30 min
Between October 2018 and March 2019, survey teams from the Rwanda Biomedical Centre (RBC) and the National Institute of Statistics of Rwanda (NISR) visited 11,219 households in every district and offered HIV testing to the people who lived there. The survey is called RPHIA, the Rwanda Population-based HIV Impact Assessment. Two of its results seem to disagree:
The first number is less than 3% of the second. So is HIV in Rwanda a small problem or a large one? Both numbers are correct, because they measure different things. A health planner who confuses them will either buy far too few medicines or wrongly decide that prevention has failed. This lesson gives you the two measures, shows you how HIV differs by age and gender, and asks you to explain why.
Definition
HIV (human immunodeficiency virus): the virus that damages the body's immune system by destroying its CD4 cells.
AIDS (acquired immunodeficiency syndrome): the late stage of untreated HIV infection, when the immune system is so weak that other infections and some cancers take hold. With treatment, a person with HIV need never reach this stage.
Prevalence: the share of a population that has a condition at one point in time. Example: 3.0% of adults aged 15–64 were living with HIV in 2018–2019.
Incidence: the share of people who did not have the condition and who acquire it during a set period, usually one year. Example: 0.08% of adults acquired HIV in a year.
Antiretroviral therapy (ART): daily medicines that stop HIV from multiplying, so the immune system can recover.
Viral load suppression (VLS): having so little virus in the blood (RPHIA used fewer than 1,000 copies per millilitre) that the person stays well and is far less likely to pass HIV on.
Percentage point: the unit for the difference between two percentages. A rise from 3.0% to 3.5% is a rise of 0.5 percentage points.
Both measures are fractions of a population, but the top and the bottom of each fraction are different.
Prevalence is a stock: everyone who has HIV today, whether they acquired it last month or twenty years ago. Incidence is a flow: only the new cases. Think of a water tank. Incidence is the tap filling it; deaths and moving away are the drain; prevalence is the water in the tank. When the drain is slowed, the tank can stay full even if the tap is turned down.
For a disease that lasts a long time and changes slowly, the three quantities are linked by an approximate rule:
ART lets people with HIV live for decades, so the average duration has grown. That is why a country can cut new infections and still see prevalence stay level.
Worked example 1: from a rate to a number of people
RPHIA found an annual incidence of 0.08% among adults, which it reported as about 5,400 new infections a year. Estimate the number of HIV-negative adults the rate applies to.
0.08% means . Then
About 6.75 million HIV-negative adults. Now check it against prevalence: 210,200 adults living with HIV at 3.0% gives adults in all. Take away those living with HIV: , very close to 6.75 million. The two published numbers agree, once you know which denominator each one uses.
Worked example 2: why a level prevalence can be good news
The Rwanda Demographic and Health Survey 2019–20 reports that HIV prevalence in Rwanda "has remained stable at 3%" since 2005, while new infections "declined from 27 to 8 per 10,000 population".
Convert the incidence to a percentage: , the same figure RPHIA measured. The earlier rate was .
The fall in incidence is . The tap was turned down by about 70%, yet the tank stayed at 3%, because ART slowed the drain: people with HIV now live long lives. A level prevalence here is a sign of success, not failure.
RPHIA reported prevalence for every five-year age group, separately for males and females. Figure 1 draws its table.
| Age group | Men (%) | Women (%) | Women ÷ men |
|---|---|---|---|
| 15–19 | 0.4 | 0.8 | 2.0 |
| 20–24 | 0.6 | 1.8 | 3.0 |
| 25–29 | 1.3 | 3.4 | 2.6 |
| 30–34 | 1.4 | 3.7 | 2.6 |
| 50–54 | 6.3 | 7.4 | 1.2 |
| 55–59 | 6.5 | 5.9 | 0.9 |
| All adults, 15–64 | 2.2 | 3.7 | 1.7 |
Three patterns stand out.
Place matters too: prevalence was 4.8% in urban areas and 2.5% in rural areas, and 4.3% in the City of Kigali.

No single cause explains why young women are more affected. Analysts group the causes into four kinds.
| Kind of cause | How it raises young women's risk |
|---|---|
| Biological | During sex, HIV passes more easily from a man to a woman than from a woman to a man, and the risk is higher in a young woman's body. |
| Partner age | When a young woman's partner is older, he comes from an age group where more people have HIV: 1.3–1.4% of men aged 25–34 against 0.4% of boys aged 15–19 (Figure 1). |
| Economic and social | Poverty and dependence on a partner for money weaken a woman's power to refuse sex or to insist on a condom. Gender-based violence takes that power away completely. |
| Health-seeking by men | Men test and start treatment later. In RPHIA, 79.1% of women living with HIV had a suppressed viral load, against 70.5% of men. A man who does not know his status cannot protect his partners. |
The most recent survey, the Rwanda Demographic and Health Survey 2025, shows the same testing gap: 77% of women aged 15–49 had ever been tested and received their result, against 71% of men. It also found that only 57% of young women and 53% of young men aged 15–24 had comprehensive knowledge of HIV prevention, down from 65% and 64% in 2014–15. (Its HIV prevalence results will appear in the final DHS report.)
Warning
Sexual contact with a child is abuse and a crime. In Rwanda a child is anyone under 18. An adult who has any sexual contact with a child commits a crime, whatever the child said and whatever gifts or money were given; the child is never to blame. If this is happening to you or to someone you know, tell a trusted adult and call a free Rwanda Investigation Bureau line: 116 (child abuse), 3512 (gender-based violence), 3029 (Isange One Stop Centre) or 166 (emergencies).
Warning
Four common mistakes
Tip
Describe, compare, explain. For any data question, first describe the overall pattern with one number, then compare two groups with a ratio or a difference, then explain the difference with at least two kinds of cause. Name the survey and its year every time.
Important
Discuss. A district health team can afford one new programme for young people. Option A: free HIV testing at football matches and motorcycle-taxi stages. Option B: a girls' club in secondary schools on HIV, consent and saving money. Use Figure 1 and the table of causes to argue for one option, and say what the other would still leave undone.
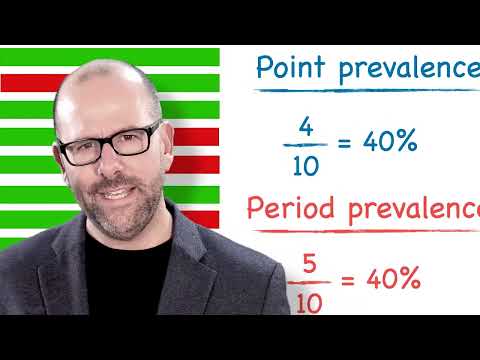
Global Health with Greg Martin: "Incidence and Prevalence", about 3 minutes. Listen for the bathtub picture, the same idea as this lesson's water tank, and for why a long-lasting condition builds up prevalence.
Practice
Key points
Sources and credits
Written by Ganzaa: the opening case, the worked examples, Figure 1 (drawn from RPHIA data), the tables, the analysis and the exercises.
This lesson adapts CC BY-SA material and is shared under CC BY-SA 4.0.
Quick check
Which measure tells a health planner whether HIV prevention is reducing new infections?