Population and Settlement
Senior 1 · Geography
Population and Settlement
Lesson 5 of 5
22 min
The 2022 census asked every Rwandan where they were born. About 2.7 million people were living in a different district from the one they were born in. Figure 1 shows the biggest movements between provinces. Before reading on, find the two provinces that receive the most arrows. What might attract people there?
Figure 1. The five largest flows of lifetime migrants between provinces (people living in a province other than their province of birth). Drawn by Ganzaa from NISR's Census 2022, Table 30.
Definition
Internal migration: movement from one place to another within the same country. Example: a family moving from Gakenke to Nyagatare.
Definition
External (international) migration: movement from one country to another. Leaving a country is emigration; entering a country is immigration. Example: a Rwandan emigrating to Canada to study; refugees from Burundi immigrating to Rwanda.
Definition
Push factor: a problem in the place people live that encourages them to leave. Example: shortage of land for a growing family in Nyamasheke.
Definition
Pull factor: an attraction of another place that draws people towards it. Example: jobs, universities and hospitals in Kigali.
Definition
Net migration: the number of people who moved in minus the number who moved out. . A positive number is a gain; a negative number is a loss. Example: Gasabo District's lifetime net migration is +273,708.
| Type | Push factors (away from home) | Pull factors (towards the destination) |
|---|---|---|
| Economic | Too little land; farms divided among children; unemployment; low incomes | Jobs in Kigali and other towns; land for farming and cattle in the east; higher wages |
| Social | Few secondary schools, colleges or hospitals nearby; family problems | Universities, good schools, hospitals, piped water and electricity in towns; joining relatives |
| Environmental | Floods, landslides and eroded steep slopes (Unit 11); drought | Safer sites; more reliable rain; fertile land |
| Political | War, violence and persecution (refugees) | Peace and security; a welcoming host country |
| District | Province | Moved in (born elsewhere) | Moved out (born here, living elsewhere) | Net lifetime migration |
|---|---|---|---|---|
| Gasabo | City of Kigali | 412,692 | 138,984 | +273,708 |
| Nyagatare | Eastern | 261,396 | 49,184 | +212,212 |
| Kicukiro | City of Kigali | 258,296 | 89,921 | +168,375 |
| Musanze | Northern | 67,088 | 73,669 | −6,581 |
| Nyamasheke | Western | 15,726 | 122,478 | −106,752 |
| Gakenke | Northern | 16,810 | 138,920 | −122,110 |
Source: NISR, Census 2022, Table 32 (selected districts).
Worked example 1: net migration
412,692 people living in Gasabo were born in another district, and 138,984 people born in Gasabo live elsewhere. Find Gasabo's net migration, and express it as a percentage of its population (879,505).
Answer. A net gain of 273,708 people, equal to about 31% of Gasabo's population. Migration has made Gasabo, a district of the capital, far bigger than it would otherwise be.
Worked example 2: a losing district
For Gakenke, 16,810 people moved in and 138,920 moved out. Find the net migration and explain the sign.
Answer. −122,110: a net loss. For every person who moved into Gakenke, more than eight moved out. Gakenke is steep, hilly and rural, with little spare land and few urban jobs.
Important
Case study: the two magnets, Kigali and the east
| Area people leave | Area people move to | |
|---|---|---|
| Positive | Less pressure on land; money sent home by migrants (remittances); returning migrants bring skills | More workers and customers; new businesses; a mix of skills and ideas |
| Negative | Loss of young, active workers; more old people and children left to farm; families separated | Crowding, housing shortages and informal settlements; pressure on schools, water and transport; unemployment if jobs are too few |
Warning
Emigration or immigration? Emigration is Exiting a country; Immigration is coming In. And keep the signs right: net migration is in minus out, so a district that loses people has a negative number.
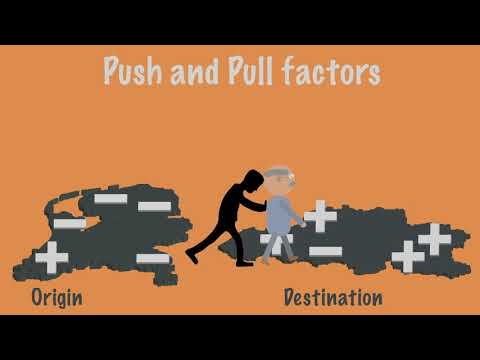
Push and Pull factors as drivers of migration, by Geography Lessons (3 min). Sort each factor you hear into the four rows of the push–pull table.
A young woman from Nyamasheke is choosing between moving to Kigali to look for work and moving to Nyagatare to farm. Using the push and pull table and the case study, give two reasons for each choice. What would you advise her, and why?
Tip
Answer migration questions on both ends and both signs: the area people leave and the area they reach, with a positive and a negative effect for each. That four-box answer covers every mark.
Practice
Remember
Further reading
Books and resources for this unit
Sources and credits
Written by Ganzaa: the lesson text, flow map, tables, worked examples and practice.