Statistics with Ungrouped Data
Senior 1 · Mathematics
Statistics with Ungrouped Data
Lesson 5 of 5
25 min
Two S1 classes both have a median mark of 60 in mathematics. In the first class almost everybody scored between 55 and 65; in the second, marks ran from 20 to 95. The averages are the same, but a teacher would plan very differently for the two classes. To describe a data set fully you need its centre and its spread: how far the values are scattered.
Definition
Range: the difference between the largest and the smallest value.
Midrange: the value halfway between the largest and the smallest value.
Definition
Quartiles: the three values that divide the ordered data into four parts with equal numbers of values.
For values in order, their positions are
Definition
Inter-quartile range (IQR): the spread of the middle half of the data,
Unlike the range, it is not affected by one very large or very small value, because it ignores the lowest and highest quarters.
Worked example 1: eleven temperatures
The maximum temperatures in Kigali on eleven days in September were (in ): 26, 28, 25, 27, 29, 26, 24, 27, 28, 26, 30. Find the quartiles, the inter-quartile range, the range and the midrange.
Solution First put the data in order:
Here , so .
Worked example 2: when the position is a half
Find the quartiles and the IQR of the nine quiz marks from Lesson 4: 9, 11, 12, 14, 15, 15, 15, 17, 18.
Solution , so .
With an odd number of values, as in this lesson, each position is either a whole number or a half.
Worked example 3: quartiles from a frequency table
Thirty-one residents of a village recorded how many of last year's 12 monthly Umuganda sessions they attended. Find the median, the quartiles and the IQR.
| Sessions attended | 6 | 7 | 8 | 9 | 10 | 11 | 12 |
|---|---|---|---|---|---|---|---|
| Residents | 1 | 2 | 3 | 5 | 7 | 8 | 5 |
| Cumulative frequency | 1 | 3 | 6 | 11 | 18 | 26 | 31 |
Solution , so . Find each position, then read down the cumulative frequencies for the first value that reaches it.
The middle half of the residents attended between 9 and 11 sessions.
Definition
Cumulative frequency diagram (ogive): a graph of cumulative frequency against value. Each point is plotted and the points are joined in order. The graph always rises from left to right and ends at .
Plot each value against its cumulative frequency from Worked example 3, start at 0 one step before the smallest value, and join the points with a ruler:
To answer "how many residents attended 9 sessions or fewer?", go up from 9 to the graph and across: 11 residents. To find how many attended more than 10, read 18 at 10 and subtract from the total: . For data that are whole numbers, read the graph only at the plotted values; the quartiles come from the table, as in Worked example 3.
Worked example 4: from an ogive back to a frequency table
Make the frequency table for the number of books read.
Solution Read the cumulative frequency at each value, then subtract each one from the next:
| Books | Cumulative frequency (read from the graph) | Frequency |
|---|---|---|
| 0 | 2 | 2 |
| 1 | 6 | |
| 2 | 13 | |
| 3 | 19 | |
| 4 | 23 | |
| 5 | 25 |
Check: , the last cumulative frequency. ✓
Warning
Two points about quartiles
Tip
Compare data sets with two numbers: an average for the centre and a spread. The two classes at the start of this lesson have the same median, 60, but the second has a much larger IQR, so its marks are far less consistent.
Work in a group of four and use everything in this unit.
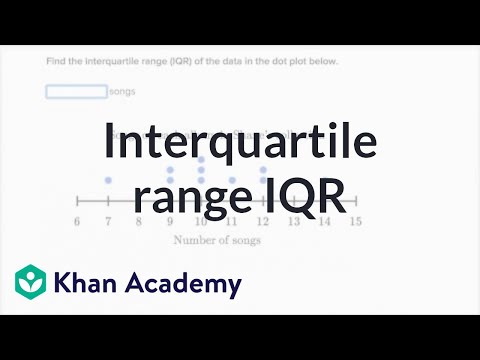
Khan Academy: How to calculate interquartile range IQR (6 min). Sal finds the quartiles as the medians of the lower and upper halves of the data; compare his answer with the position rule in this lesson.
Practice
Use an odd number of values, as in the lesson. Question 7 is harder.
Further reading for this unit
Sources and credits
The position rule for quartiles, the cumulative frequency diagrams, the Rwandan data, the project, the practice items and the quiz questions were written by Ganzaa.