Concept of an Ecosystem
Senior 6 · Biology
Concept of an Ecosystem
Lesson 2 of 5
25 min
The Rugezi wetland in the north of Rwanda covers thousands of hectares of waterlogged peat. No ecologist can count every sedge in it. Yet conservation decisions, such as whether a drained part of the marsh is recovering, need numbers. The answer is sampling: measure a small part of the ecosystem in a way that fairly represents the whole, then use statistics to judge how far the sample can be trusted.
This lesson covers the methods an ecologist uses, the calculations you will be asked to do in the national exam, and succession: the way a community changes, predictably, over time.
Definition
Sample: a small part of a population or area that is measured in order to estimate a feature of the whole.
Quadrat: a square frame of known area, often (50 cm by 50 cm) or , placed on the ground to sample plants or slow-moving animals.
Transect: a line laid across a habitat, along which samples are taken at regular intervals. A belt transect places quadrats continuously or at intervals along the line.
Species richness: the number of different species in an area. Species diversity takes into account both the number of species and how evenly the individuals are spread among them.
| Random sampling | Systematic sampling | Stratified sampling | |
|---|---|---|---|
| How the positions are chosen | Lay two tapes at right angles; use pairs of random numbers as coordinates, and place a quadrat at each | Place quadrats at regular intervals along a transect | Divide the area into zones and sample each in proportion to its size |
| Use it when | The area looks uniform, or you compare two areas; it avoids bias from choosing "interesting" spots | A factor changes across the area, such as soil water from a lake shore to dry land | The area has distinct zones, such as open water, sedge and grass in a marsh |
Animals need other tools: a sweep net for insects in grass, a pitfall trap for walking ground insects, a pooter to suck up small insects without harming them, a Tullgren funnel to drive small animals out of leaf litter, and kick sampling for invertebrates in a stream. Estimating the size of a whole animal population by capture and recapture comes in Unit 2.

Worked example 1: density, frequency and spread
A student placed ten random quadrats on a grazed slope and counted one herb species (illustrative data): 3, 5, 0, 2, 4, 6, 1, 3, 2, 4.
Calculate (a) the mean number per quadrat, (b) the density, (c) the frequency and (d) the standard deviation.
Interpretation: the standard deviation is large compared with the mean (about 61 % of it), so the plants are unevenly spread. More quadrats would give a more reliable mean.
Where one abiotic factor changes steadily across the ground, the plants change with it in bands, or zones. Figure 1 shows a belt transect across the edge of a highland marsh. The results are drawn as a kite diagram: the width of each kite at each station is proportional to the percentage cover of that group of plants.
Figure 1: A belt transect and kite diagram across the edge of a marsh (illustrative data). The scale bar on the right shows the width of a kite at 100 % cover.
Read Figure 1 from left to right. Floating-leaved plants dominate the open water, sedges the waterlogged margin (peak cover 80 % at 20 m), grasses the damp ground (70 % at 50 m) and shrubs the driest ground (70 % at 70 m). The bottom row shows why: soil water falls from 95 % to 25 %. Each group lives where the soil water lies within its range of tolerance (Lesson 1) and where it out-competes its neighbours.
A correlation is not a cause. Soil water and plant cover change together along the transect, but so do soil oxygen, soil depth and height above the water. To show that soil water is the cause, you would need an experiment in which only soil water is changed.
Definition
Simpson's index of diversity: , where is the number of individuals of one species and the total number of individuals of all species. runs from 0 (one species only) towards 1 (many species, evenly spread).
Spearman's rank correlation coefficient: , where is the difference between the two ranks of each pair and the number of pairs. It runs from −1 (perfect negative correlation) to +1 (perfect positive correlation).
Worked example 2: Simpson's index for two sites
Plants were counted in the same area of an undisturbed marsh margin (site A) and a drained, grazed part of it (site B) (illustrative data). Site A: five species with 40, 25, 15, 12 and 8 plants. Site B: three species with 85, 10 and 5 plants. Calculate for each site and compare.
Worked example 3: is sedge cover correlated with soil water?
Eight random quadrats on a marsh margin gave these results (illustrative data). Test the correlation at the 5 % significance level. The critical value of for (two-tailed, ) is 0.738.
| Quadrat | 1 | 2 | 3 | 4 | 5 | 6 | 7 | 8 |
|---|---|---|---|---|---|---|---|---|
| Soil water / % | 88 | 75 | 62 | 91 | 55 | 70 | 80 | 48 |
| Sedge cover / % | 70 | 52 | 48 | 60 | 30 | 55 | 64 | 38 |
| Rank of soil water | 2 | 4 | 6 | 1 | 7 | 5 | 3 | 8 |
| Rank of sedge cover | 1 | 5 | 6 | 3 | 8 | 4 | 2 | 7 |
| 1 | −1 | 0 | −2 | −1 | 1 | 1 | 1 | |
| 1 | 1 | 0 | 4 | 1 | 1 | 1 | 1 |
Condition: Spearman's test needs at least 5 pairs, preferably 10 or more, and shows correlation, not causation.
Warning
Safety and permission in wetland fieldwork
Leave a field uncultivated in Rwanda and within a few months weeds cover it; within a few years shrubs appear; given decades without fire, grazing or digging, trees would take over. This orderly change in a community over time is ecological succession.
Each stage, called a seral stage, changes the conditions: deeper soil, more humus and minerals, more shade, more moisture. These changes let new species arrive that out-compete the ones that made the change. The succession ends in a climax community, stable as long as the climate stays the same; in most of Rwanda's highlands that would be forest. Figure 2 shows how biomass and diversity change.
Figure 2: Primary succession on a lava flow (illustrative). Biomass rises in an S-shaped curve; diversity peaks in the middle stages.
Diversity peaks before the climax because the middle stages hold a mixture of species from the earlier and later stages; at the climax, a few tall, dominant trees shade out many smaller plants.
A hydrosere is a succession that starts in open water. Sediment and dead plants slowly fill a shallow lake or pond: floating plants give way to sedges and reeds, then to marsh grasses, then to shrubs on the drier ground. The zones in Figure 1, from water to dry land, are a picture in space of that change in time.
Deflected succession. Where people or animals repeatedly interrupt succession, by grazing, burning, mowing or farming, the community is held at an earlier stage, called a plagioclimax. Pasture grazed by cattle stays grassland; on the savanna of Akagera, fire and browsing by large herbivores keep woody plants from closing the canopy.

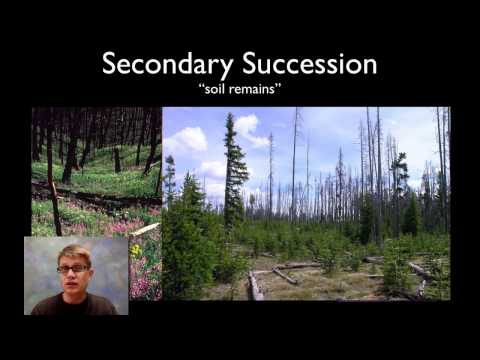
Bozeman Science: "Ecological Succession". Watch for the difference between primary and secondary succession, and note the pioneer species named at the start of each.
Tip
Exam technique for succession. Answer in a chain: "Pioneer species colonise → they change the abiotic conditions (soil depth, humus, water, shade) → the new conditions suit other species → these out-compete the earlier ones." Examiners reward the idea that each stage makes the habitat less suitable for itself and more suitable for the next.
Practice: sampling and succession
Key points
Sources and credits
Figures 1 and 2, the tables, the worked examples and the practice questions are written by Ganzaa. All data in them are illustrative. The critical value of for was checked by exact calculation over all 40 320 rankings.
This lesson adapts CC BY-SA material and is shared under CC BY-SA 4.0.