Simultaneous Linear Inequalities
Senior 3 · Mathematics
Simultaneous Linear Inequalities
Lesson 3 of 4
25 min
A graph can solve an inequality in one unknown. To solve , draw the line and the horizontal lines and . The solution is the set of -values where the line lies above and on or below .
Reading down from the ends of the orange part gives . Algebra agrees: add 1 to get , then divide by 2.
With two unknowns, a solution is no longer a number but a point , and the solution set becomes a region of the plane.
Definition
Linear inequality in two unknowns: an inequality that can be written as , , or , where and are not both zero. A solution is an ordered pair that makes it true.
Example: is a solution of , because . The pair is not, because .
Definition
Boundary line and half-plane: the line divides the plane into two half-planes. Every point of one half-plane satisfies ; every point of the other satisfies .
Notation on a graph: draw the boundary solid for or (its points are solutions) and dashed for or (its points are not).
Example: for the boundary is dashed.
Important
Graphing in three steps
Why one point is enough: the expression can change sign only on the line, where it equals 0. So every point on one side gives the same answer as the test point.
Worked example 1: a solid boundary
Show the region .
Solution Boundary : when , ; when , . Draw a solid line through and because of .
Test : , true. Shade the side that contains the origin.
Worked example 2: a dashed boundary
Show the region .
Solution Boundary : gives , and gives . Draw a dashed line through and because of .
Test : , true. Shade the side containing the origin, which is the side above the line.
Important
Which region to shade. In this course the shaded region is the wanted region, the solution set. Some exam papers ask the opposite: shade the unwanted region, so that the solution is left clear. Always follow the question's instruction, and write a short key such as "the solution is the shaded region".
Definition
System of linear inequalities in two unknowns: two or more such inequalities that must hold at the same time. Its solution set is the intersection of the separate half-planes, called the feasible region. The points where two boundary lines meet are its vertices (corners).
Example: the system , , has as feasible region the triangle with vertices , and .
Worked example 3: a system of three inequalities
Show the feasible region of and find its vertices.
Solution Draw each boundary and decide its side.
| Inequality | Boundary and two points | Line | Test point | Keep |
|---|---|---|---|---|
| solid | : false | above | ||
| , | solid | : true | origin side | |
| , | dashed | : true | right of the line |
For the line passes through the origin, so the test point is instead.
Vertices, by solving pairs of boundary equations: and give ; and give ; and give , so .
Check a point inside, : ✓, ✓, ✓.
Worked example 4: from a region back to the inequalities
The shaded triangle below, including its sides, is the solution set of a system of three inequalities. Find them.
Solution Side AC is the vertical line , and the region lies to its right: . Side AB is the horizontal line , and the region lies above it: .
Side BC passes through and . Its gradient is , so , that is, , or .
A point inside, such as , gives , so the region is . The system is , , .
Warning
Don't shade by the look of the sign. "Less than" does not always mean "below the line". For , the test point gives , true, and the origin lies above the boundary. Make the subject first (), or simply use a test point.
Never use a test point that lies on the boundary. It gives or and tells you nothing about the sides.
Tip
Label every line with its equation and mark the vertices with their coordinates. In an exam, most marks for a region come from correct boundaries: right line, right style (solid or dashed), right side.
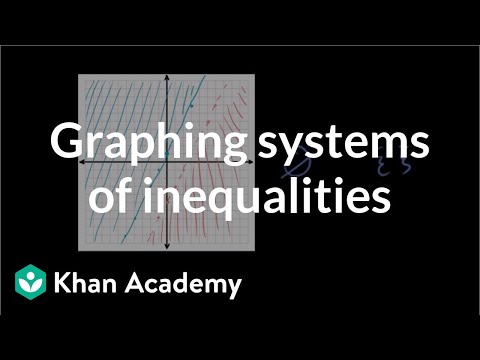
Khan Academy: Graphing systems of inequalities and checking solutions. Watch how each boundary is drawn dashed or solid, how the overlapping region is found, and how a point is checked against every inequality in the system.
Practice
Draw each region on squared paper. The last three are harder.
Sources and credits
The graphs, the worked examples, the practice items and the quiz questions were written by Ganzaa.