Economic Growth, Underdevelopment and Economic Development
Senior 6 · Economics
Economic Growth, Underdevelopment and Economic Development
Lesson 4 of 5
25 min
In April 2025 NISR published the seventh Integrated Household Living Conditions Survey (EICV7). It found that 27.4% of Rwandans were poor in 2023–24, measured against a national poverty line of Frw 560,127 of consumption per adult equivalent a year, at January 2024 prices. Under the same method, the rate would have been 39.8% in 2017 (NISR, EICV7 Poverty Profile, pp. 24–25).
The World Bank, using its international line of US$3.00 a day at 2021 purchasing-power parity, puts Rwanda's poverty rate at 38.6% in 2023 (World Bank, World Development Indicators).
Think: how can the same country, in almost the same year, have a poverty rate of 27.4% and of 38.6%? Which is "right"? And what keeps a family poor from one generation to the next?
Definition
Underdevelopment: a state in which a country's people have low incomes and poor living conditions (in health, education, housing and security) because the economy's resources, technology and institutions are not yet able to provide better ones, although they could be improved.
Least developed country (LDC): a UN category for low-income countries with weak human assets and high economic vulnerability. Rwanda is on the UN's list of LDCs.
| Indicator | What it shows | Rwanda (source, year) |
|---|---|---|
| Low income per head | Little output per person to consume or save | GDP per head US$1,124 (World Bank, 2025) |
| Widespread poverty | Many households cannot afford basic needs | 27.4% below the national line (NISR EICV7, 2023–24) |
| Poor health and nutrition | Short lives, stunted children, low productivity | Stunting of children under five: 27% (NISR, Rwanda DHS 2025); life expectancy 67.8 years (UNDP, 2023) |
| Low education | Few skills to use modern technology | Mean years of schooling of adults: 4.9 (UNDP, 2023) |
| Rapid population growth | A high dependency ratio; income is spread thinly | 2.3% a year, 2012–2022 (NISR census) |
| Dualism | A modern urban sector beside a traditional rural one | Poverty 16.7% in urban areas, 31.6% in rural areas (NISR EICV7, 2023–24) |
| Inequality | Gains are not shared | Gini coefficient 0.370 (NISR EICV7, 2023–24) |
Other common features are a large share of employment in low-productivity farming, dependence on a few primary exports, low saving and investment, poor infrastructure, open and disguised unemployment, and a large informal sector.
| Internal causes | External causes |
|---|---|
| Low saving and investment, so little capital per worker | A colonial legacy of economies built to export raw materials |
| Low human capital: poor schooling, health and nutrition | Falling or unstable terms of trade for primary exports |
| Rapid population growth | Protection of farm and processed goods by rich countries |
| Poor infrastructure: roads, power, water | Heavy external debt and its repayments |
| Low technology and reliance on rain-fed farming | Brain drain: skilled workers move abroad |
| Weak institutions, corruption and conflict | Profits of foreign firms sent abroad; capital flight |
| Geography: being landlocked, far from ports | Aid that creates dependence (Unit 8) |
Definition
Vicious circle of poverty: a chain of causes and effects in which poverty produces the conditions that keep a country or household poor. Ragnar Nurkse (Problems of Capital Formation in Underdeveloped Countries, 1953) summed it up as "a country is poor because it is poor".
On the supply side, low incomes leave little to save, so investment is low, capital is scarce and productivity stays low, which keeps incomes low. On the demand side, low incomes mean a small market, so firms have little reason to invest even when they could finance it; again capital is scarce and incomes stay low.
The circles show why a single measure rarely works. More saving (supply side) is wasted if no one buys the extra output (demand side). Nurkse therefore argued for investment in many industries at once, so that each creates a market for the others: the balanced growth strategy of Unit 8. The circle can also be broken from outside, by aid, foreign investment or export markets, or from within, by raising productivity in farming.
Definition
Poverty: the lack of enough income or resources to meet basic needs (food, shelter, clothing, health care and education) and to take part in society.
Absolute poverty: consumption or income below a fixed poverty line, the cost of a minimum bundle of basic needs. Extreme poverty uses a lower line, often the cost of a basic diet alone.
Relative poverty: having much less than most people in the same society, for example less than half the median income. It rises when inequality rises, even if everyone's income grows.
| Type | Meaning | Example |
|---|---|---|
| Absolute and extreme | Below a fixed line of basic needs; extreme poverty below the food line | EICV7: 27.4% below the total line, 5.4% below the food line (2023–24) |
| Relative | Far below the living standard typical in the society | A family in Kigali with a phone and a TV, but far below its neighbours |
| Chronic (structural) | Lasts for years or generations, rooted in lack of land, skills or assets | A landless labourer's household |
| Transient | A temporary fall below the line after a shock | A harvest lost to drought, or illness of the main earner |
| Rural and urban | Rural poverty is linked to small farms and low yields; urban poverty to low wages and high costs | EICV7: 31.6% rural, 16.7% urban |
| Multidimensional | Deprivation in several areas at once: health, education, living conditions | No clean water, no electricity and a child out of school |
Why two rates in the opening case? NISR's line is built from the cost of basic needs in Rwanda and measures consumption per adult equivalent; the World Bank's US$3.00 line is the same for all countries, so that they can be compared. Each answers a different question, so a figure is meaningless without its line and its year.
Worked example
Worked example 1: headcount and poverty gap (illustrative figures)
Eight adults in a village consume, in thousands of francs a year: 300, 420, 500, 540, 610, 800, 950 and 1,200. Take a poverty line of and an extreme line of 356.
Headcount ratio (share of people who are poor): four of eight are below 560, so
Only one (300) is below 356, so extreme poverty is .
Poverty gap index (the average shortfall, as a share of the line, counting the non-poor as zero):
The poor fall short of the line by a total of 480 thousand francs a year. With perfect targeting, transfers of this amount would end poverty in the village. The headcount says how many are poor; the gap says how poor they are.
Worked example 2: percentage points or per cent?
EICV7 reports that poverty fell from 39.8% (2017) to 27.4% (2023–24), and extreme poverty from 11.3% to 5.4%. Describe each fall in two ways.
Extreme poverty fell by fewer percentage points but by a larger proportion: it roughly halved.
Warning
Don't compare poverty rates across different lines or methods. EICV7 changed NISR's method, so its 27.4% cannot be compared directly with rates published after earlier surveys; that is why NISR re-estimated 2017 as 39.8% under the new method. In the same way, a World Bank rate at US$3.00 a day cannot be set against a national rate.
The Lorenz curve plots the share of total consumption (or income) received by the poorest x% of the population. If everyone had the same, it would follow the diagonal. The Gini coefficient is the area between the diagonal and the curve (A) as a fraction of the whole triangle (A + B): 0 means perfect equality and 1 means one person has everything. EICV7 found inequality much higher in towns (0.438), and highest of all in Kigali City (0.445), than in rural areas (0.263) (NISR, EICV7 Poverty Profile, Table 7.1, p. 39).

| Strategy | How it works | In Rwanda |
|---|---|---|
| Broad-based growth | Creates jobs and raises demand for what the poor produce | NST2's target of 1.25 million productive jobs (NST2, p. 12) |
| Raising farm productivity | Most poor households farm, so higher yields raise their incomes directly | Unit 6 |
| Productive assets and skills | Gives households a way to earn, not only a transfer | Livestock, toolkits and vocational skills in NST2's "graduation from poverty" (p. 29); the Girinka cow programme |
| Social protection | Cash or work for those who cannot yet earn enough; protects against shocks | Vision Umurenge Programme (VUP) transfers and public works; Community Based Health Insurance (NST2, p. 29) |
| Human capital | Education, health and nutrition raise future earning power | Stunting target: from 33% to 15% (NST2, p. 25) |
| Saving and credit | Lets households invest and cope with bad years | SACCOs and the Ejo Heza long-term savings scheme (NST2, p. 29) |
| Redistribution | Progressive taxes finance services for the poor | Free basic education; subsidised health insurance for the poorest |
Tip
Break the circle at a named link. In an essay on poverty reduction, don't just list policies. Say which link of the vicious circle each one breaks: VUP public works raise income; SACCOs raise saving; roads and electricity raise the inducement to invest; schooling and nutrition raise productivity.
Important
Discuss. EICV7 found that inequality is far higher in towns than in the countryside, while poverty is far higher in the countryside. Should Rwanda's poverty policy focus on rural areas, on towns, or on both? Justify your answer with figures from this lesson.
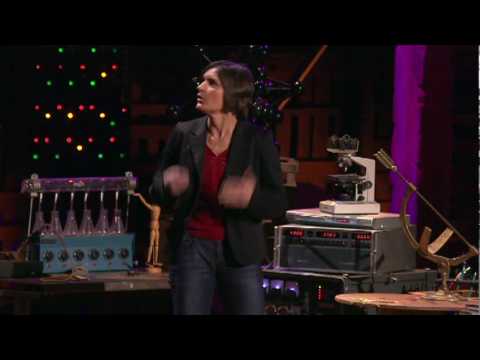
TED, "Esther Duflo: Social experiments to fight poverty" (about 17 minutes, 2010). Duflo, who later shared the 2019 Nobel Prize in economics, shows how randomised trials test which anti-poverty measures work. Note the three questions she asks and the evidence behind each answer.
Practice
Sources and credits
Written by Ganzaa: the text, the vicious-circle and Lorenz-curve diagrams, the tables, the worked examples and the practice items. The village figures in worked example 1 and the practice items are illustrative; the shape of the Lorenz curve in the diagram is illustrative.