Market Structures
Senior 5 · Economics
Market Structures
Lesson 5 of 5
50 min
Walk down a busy street in any Rwandan town and you may pass a dozen hair salons. Each offers much the same service, but not quite: one has the stylist everyone asks for, another is next to the bus stop, a third plays better music. A new salon needs only a chair, a mirror, clippers and a licence. Now think of the mobile phone market: two large networks, each watching every move the other makes. When one launches a cheaper bundle, the other responds within days. The salons are in monopolistic competition; the networks form an oligopoly. Most of the goods and services you buy come from markets like these, between the two extremes of the last three lessons.
Definition
Monopolistic competition: a market structure with many firms selling similar but differentiated products, free entry and exit, and some control over price. Each firm is a "monopolist" of its own brand, but faces close competition from many substitutes.
Product differentiation: making a product different, or seem different, from rivals' products, through quality, design, location, service, brand name or packaging.
Features. Many sellers, each with a small share; differentiated products; free entry and exit in the long run; a downward-sloping but fairly elastic demand curve (many close substitutes); heavy use of non-price competition such as branding and advertising.
Short run. The firm behaves like a small monopolist: it produces where and reads its price from its demand curve. If demand is strong it earns abnormal profit.
Long run. Because entry is free, abnormal profit attracts new firms with similar products. Each existing firm loses some customers, so its demand curve shifts left, and it becomes more elastic because there are now more substitutes. Entry continues until the demand curve just touches (is tangent to) the ATC curve. At that point the best the firm can do is : normal profit.
Definition
Excess capacity: the gap between the output a firm actually produces and the output at which its average total cost would be lowest. In long-run monopolistic competition the tangency is on the falling part of ATC, so each firm produces less than and could produce more at lower average cost.
Worked example 1: a salon in the short and the long run
A salon charges Frw 3,000 a haircut and serves 400 customers a month. At that output its average total cost, including the owner's normal profit, is Frw 2,400 (illustrative).
Two new salons open on the same street. The first salon loses customers and, facing more substitutes, finds it must cut its price to keep the rest. Suppose its best position is now 300 customers at Frw 2,700, where ATC is also Frw 2,700 because fixed costs (rent, chairs) are spread over fewer heads. Profit per customer : only normal profit remains. That is the long-run tangency. Its chairs stand empty part of the day, which is excess capacity in practice.
Definition
Oligopoly: a market dominated by a few large firms whose decisions are interdependent: each firm's best price or output depends on how it expects its rivals to react.
Concentration ratio: the combined market share of the largest firms. The n-firm concentration ratio adds the shares of the n largest. A high or (often above 60%) indicates oligopoly.
Features of oligopoly. A few large firms with a high concentration ratio; high barriers to entry (economies of scale, licences, brand loyalty, heavy capital); products that may be identical (cement, fuel) or differentiated (beer, phone services); interdependence; price rigidity; and intense non-price competition. Examples in Rwanda include mobile telephone services, beer brewing and cement.
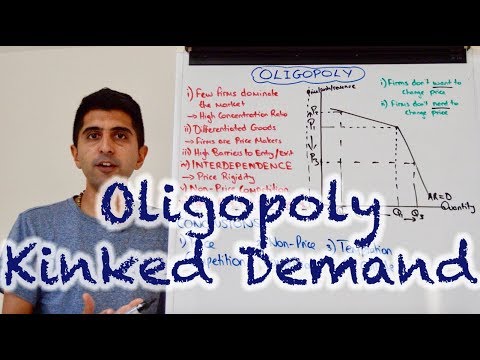
Paul Sweezy (1939) suggested that an oligopolist expects its rivals to react asymmetrically:
The demand curve therefore has a kink at the current price . Each section has its own MR curve, and they do not join: there is a vertical gap in MR at . Any MC curve that passes through the gap (MC1, MC2) gives the same profit-maximising output and price. So costs can rise or fall within a range without the firm changing its price: price rigidity.
Warning
What the kinked demand model does not do. It explains why a price, once set, tends to stay put. It does not explain how the price was reached in the first place, and in practice oligopolists do raise prices together, for example when all their costs rise at once, as after a fuel price increase. Mention both points when you evaluate the model.
| Method | What it means |
|---|---|
| Collusion and cartels | Firms agree on price or output (formal collusion), acting like one monopolist. Cartels are illegal under most competition laws, and tend to break down because each member gains by secretly cheating on the agreement |
| Tacit collusion | No written agreement, but firms avoid price competition and follow each other's moves |
| Price leadership | One firm sets the price and the others follow: a dominant leader (the biggest firm) or a barometric leader (the firm best at reading market conditions) |
| Cost-plus (mark-up) pricing | Price = average cost + a percentage mark-up; simple, and similar firms with similar costs end up at similar prices |
| Limit pricing | Keeping the price low enough to make entry unprofitable for newcomers |
| Predatory pricing | Cutting price below cost to drive a rival out, then raising it again; illegal in many countries |
| Price war | Rounds of price cuts by rivals trying to win market share; good for consumers in the short run, costly for firms |
Because price cuts are matched, oligopolists compete in other ways: advertising and branding; packaging and design; promotions, free gifts and loyalty rewards (bonus airtime, for instance); after-sales service and warranties; credit and delivery; product innovation; sponsorship of sports and events; and convenient locations and agents.
Worked example 2: concentration ratio and a mark-up price
(a) The market shares of the firms in an industry are 38%, 27%, 15%, 8% and 5%, with the remaining 7% split among many small firms (illustrative). Find .
Three firms control four-fifths of the market: an oligopoly.
(b) A brewer's average variable cost per crate is Frw 6,000 and its overheads add Frw 2,000 per crate. It applies a 25% mark-up. Find its price.
| Feature | Perfect competition | Monopolistic competition | Oligopoly | Monopoly |
|---|---|---|---|---|
| Number of firms | Very many | Many | Few, interdependent | One |
| Product | Homogeneous | Differentiated | Homogeneous or differentiated | Unique |
| Entry | Free | Free | High barriers | Blocked |
| Firm's demand curve | Horizontal | Downward, elastic | Kinked (in Sweezy's model) | Downward: the market demand |
| Long-run profit | Normal | Normal | Usually abnormal | Abnormal |
| Price compared with MC | P = MC | P > MC | P > MC | P > MC |
| Productive efficiency (min ATC) | Yes, in the long run | No: excess capacity | Not necessarily | Not necessarily |
| Non-price competition | None | Heavy | Very heavy | Little need |
| Rwandan illustration | Farm produce at rural markets (close to it) | Salons, restaurants, tailors | Mobile networks, brewing, cement | The national electricity grid |
Important
Discuss. Rwanda's mobile telephone market has two networks. Using the kinked demand curve and the list of non-price competition methods, explain why the two networks might compete hard on bonuses and promotions but rarely start a price war. Would a third network benefit consumers? Consider barriers to entry in your answer.
EconplusDal, "Oligopoly: Kinked Demand Curve" (about 11 minutes). Watch how the gap in the MR curve is derived, then check that both MC curves in the drawing above pass through it.
Practice
Further reading
Sources and credits
Written by Ganzaa: the text, the three diagrams (computed from the stated cost function; the long-run demand curve is solved to be tangent to ATC), the tables, the worked examples and the practice items. The salon, market shares and costs are illustrative.