Sources of Energy in the World
Senior 4 · Physics
Sources of Energy in the World
Lesson 3 of 4
25 min
Rwanda Energy Group (REG) lists the Hakan peat-to-power plant, with a nameplate rating of 70 MW, as the largest power station in Rwanda (REG, 2025). Peat dug from the swamps of the south is burned to boil water; the steam spins a turbine; the turbine turns a generator; and the electricity travels along high-voltage lines, then local lines, to homes and factories. At every step some energy leaves as heat that can no longer do anything useful. In S3 you met transformers and saw why power lines carry high voltages. In this lesson you put numbers on both halves of the journey: how much of the fuel's energy becomes electricity, and how much of that electricity is lost on the way to the user.
No device creates energy; each one converts it from one form to another, and every real conversion also produces some internal energy (heat) that spreads into the surroundings. Table 3.1 lists the conversions you meet between a fuel, or a river, and a working appliance.
| Device | Energy in | Useful energy out | Typical efficiency |
|---|---|---|---|
| boiler (furnace) | chemical energy of the fuel | internal energy of high-pressure steam | 85–90% |
| steam turbine with condenser (the steam cycle) | internal energy of the steam | kinetic energy of the spinning shaft | about 40% |
| generator | kinetic energy of the shaft | electrical energy | 98–99% |
| transformer | electrical energy at one voltage | electrical energy at another voltage | 98–99.5% |
| water turbine and generator | gravitational potential energy of water | electrical energy | 85–90% |
| solar (photovoltaic) panel | energy of sunlight | electrical energy | 15–22% |
| electric motor | electrical energy | kinetic energy | 85–95% |
Table 3.1: Energy conversions and typical efficiencies of large modern equipment, rounded.
One row stands out. The steam cycle turns only about 40% of the steam's energy into work, and most of the rest is handed to cooling water in the condenser, where the used steam is turned back into water. This is not careless engineering: the second law of thermodynamics, which you meet in Unit 9, forbids any engine from turning all of the heat it takes in into work.
Definition
The efficiency of a device is the fraction of the energy put into it that comes out in the useful form:
It has no unit and is often given as a percentage. For every real device ; the rest is wasted energy, usually internal energy of the surroundings. Example: a motor that takes 2.0 kW from the mains and delivers 1.7 kW of mechanical power has , or 85%; the other 0.3 kW warms the motor and the air around it.
In a power station the devices work in series: the useful output of the boiler is the input of the turbine, whose output is the input of the generator. If the stages have efficiencies , then , and , so
Efficiencies in a chain multiply; they never add. A chain is always less efficient than its worst link.
A Sankey diagram shows the same idea as a picture. A band whose width is proportional to the energy flows from left to right; at each stage a branch peels off for the energy wasted there, and what is left flows on. Because energy is conserved, the widths of all the branches and the final band add up to the width of the input band. Figure 3.1 shows a typical fuel-burning power station.
Figure 3.1: A Sankey diagram of a steam power station, for every 100 MJ of chemical energy in the fuel. The values are typical, not those of a particular plant.
Worked example 1: the chain in a peat-fired station
A peat-fired station has a boiler of efficiency 85%, a steam cycle of efficiency 40% and a generator of efficiency 98%. (a) Find its overall efficiency. (b) It delivers 70 MW of electrical power. At what rate must energy be supplied in the fuel, and at what rate is energy wasted? (c) Taking the specific energy of the peat as (an assumed value), find the mass of peat burned each hour.
(a) , or 33%.
(b) ; wasted: .
(c) Mass per second: ; per hour: tonnes.
Two-thirds of the energy dug out of the swamp leaves as heat. For every unit of electricity, the station must also get rid of two units of heat, which is why steam stations need a large supply of cooling water or cooling towers.
Worked example 2: reading a Sankey diagram
Use Figure 3.1. (a) Find the efficiency of the station. (b) A station with this diagram delivers 50 MW to the grid. At what rate does it give heat to its cooling water? (c) Which single change would save the most energy, and why is it hard to make?
(a) , or 32%.
(b) The branches are in proportion, so .
(c) The condenser branch (52 out of 100) is by far the widest. It can be narrowed only a little by running the boiler hotter, which is limited by what the steel can withstand. Its heat can, however, be used, for example to heat buildings or dry crops, which is what "combined heat and power" stations do.
A transmission line is a long conductor with resistance . When a power station sends power at voltage , the current in the line is , and the line turns electrical energy into internal energy at the rate
For a given power and line, the fraction lost falls as the square of the voltage: double the voltage, and the loss falls to a quarter. Transformers make this possible: a step-up transformer at the power station raises the voltage and lowers the current by the same factor, and step-down transformers near the users bring the voltage back to a safe level. Transformers work only with a changing current, which is one main reason why grids use alternating current.
Figure 3.2 shows the journey in Rwanda. REG's transmission network uses 220 kV and 110 kV lines, 1158 km of them at the end of June 2023 (REG). Medium-voltage lines run at 30 kV in rural areas and 15 kV in some urban areas, and transformers on poles step down to 400 V and 230 V for users (REG Reticulation Standard, 2020).
Figure 3.2: From power station to home: the voltages used on Rwanda's grid (REG). The current, and so the I²R loss, is smallest where the lines are longest.
Why not use even higher voltages? Each step up needs taller towers, longer insulators, wider cleared strips of land and costlier transformers, and above a few hundred kilovolts the air around a thin wire begins to conduct (a corona discharge, which wastes energy and makes a crackling sound). Engineers choose the voltage that gives the lowest total cost of losses plus equipment for the distance and power involved.
Definition
The transmission loss of a line is the rate at which it converts electrical energy into internal energy because of its resistance: , where is the current in the line and its total resistance. For power sent at voltage , the fraction lost is . Example: 10 MW sent at 110 kV through 5.0 Ω loses , or 0.41%.
Worked example 3: the same power at three voltages
A power station sends 50 MW along a line of total resistance 4.0 Ω. Find the current, the power lost and the percentage lost if the power is sent at (a) 30 kV, (b) 110 kV, (c) 220 kV.
| Voltage | Percentage lost | ||
|---|---|---|---|
| 30 kV | 22% | ||
| 110 kV | 1.7% | ||
| 220 kV | 0.41% |
Raising the voltage from 110 kV to 220 kV halves the current and quarters the loss. At 30 kV more than a fifth of the power would warm the wires, which is why medium-voltage lines are kept for shorter distances.
Worked example 4: losses on Rwanda's grid
REG's plan for 2025 expects a total supply of 1619.5 GWh, with 50.0 GWh lost in transmission and 202.0 GWh lost in distribution (REG, 2025, Table 9). Find each loss as a percentage of the supply, and explain why one is much larger.
Together about 15.6% of the supply, roughly one unit in every six, never reaches a customer. Distribution loses four times as much because its lines run at 30 kV, 15 kV and 400 V: for the same power the current is many times larger than at 110 kV or 220 kV, and there are many thousands of kilometres of these lines and many transformers. (Distribution figures also include energy that is used but never billed, for example through illegal connections.)


Warning
Common mistakes. (1) Adding efficiencies in a chain: 85% and 40% give , not 125% or 62.5%. (2) Using with the supply voltage to find the line loss: the supply voltage is not across the line. Use with . (3) Thinking high voltage lowers the power sent: the power is the same; it is the current that falls. (4) Drawing a Sankey diagram whose branches do not add up to the input.
Tip
Memory hook: "Loss goes as one over V squared." Same power, twice the voltage, half the current, a quarter of the loss. For a chain of devices, multiply the efficiencies, and remember the answer can never be larger than the smallest one.
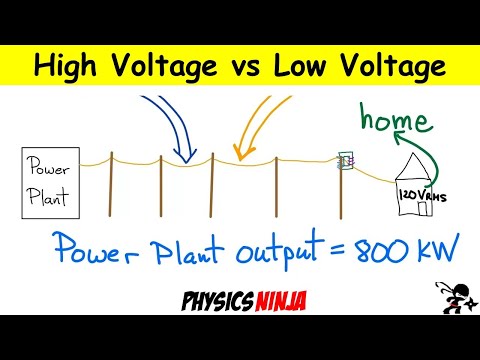
Why do Power Lines use High Voltage? (Physics Ninja). Watch how the power lost in the line, I²R, is compared for the same power sent at a low and at a high voltage, and check the result against Worked example 3.
Practice
Key points
Sources and credits
Written by Ganzaa: the lesson text, derivations, Sankey diagram, grid diagram, tables, worked examples and practice exercises. This lesson adapts CC BY-SA material and is shared under CC BY-SA 4.0.
Quick check
A station sends the same power along the same line, but at twice the voltage. The power lost in the line becomes: