Forestry in Rwanda
Senior 4 · Geography
Forestry in Rwanda
Lesson 3 of 4
25 min
Between 2009 and 2019 Rwanda planted more forest than it lost, but not everywhere. Figure 4 compares the two by province.
Figure 4. Forest deforested and afforested by province, 2009–2019. Drawn by Ganzaa from the Ministry of Environment's forest mapping, in REMA (2021).
Which province lost more than it gained? What kind of forest grows there? The answer points to the main cause of deforestation in Rwanda today.
Definition
Deforestation: the permanent removal of forest so that the land is used for something else. Deforestation rate: area deforested as a percentage of the forest at the start of the period.
Ecosystem services: the benefits people get from nature, such as clean water, soil protection, carbon storage and pollination.
Worked example 1: deforestation and afforestation rates, 2009–2019
Data (MoE 2019, in REMA 2021). Rwanda: forest 673,504 ha in 2009; 105,713 ha deforested; 139,674 ha afforested. Eastern Province: 296,234 ha in 2009; 65,807 ha deforested; 40,729 ha afforested.
Interpretation. Nationally the gain outweighed the loss (net +5.0%), but the east lost more than a fifth of its 2009 forest and replaced only about three-fifths of that. REMA explains it by agricultural expansion: cultivation and livestock keeping with clear cutting of native savannah trees. A national net gain can hide a regional loss of natural woodland.
| Importance | Evidence |
|---|---|
| Economy | Forestry added Frw 843 billion in 2025, about 3.6% of GDP and 17.8% of the value added of agriculture, forestry and fishing (NISR) |
| Energy | Forests provided around 86% of primary energy, mainly for cooking (REMA, 2021) |
| Jobs and income | Planting, nurseries, felling, charcoal, carpentry, transport and trade in wood |
| Raw materials | Poles, timber, furniture, bamboo, honey, medicines |
| Water | Forested catchments such as the Upper Nyabarongo, "Rwanda's water tower" (RWB), store rain and feed rivers |
| Soil and hazards | Roots and litter hold soil on steep slopes and reduce landslides |
| Climate | About 135 tonnes of carbon per hectare of forest (FAO, in REMA, 2021) |
| Biodiversity and tourism | Chimpanzees and orchids in Nyungwe; gorillas in the Volcanoes park |
| Research and education | The Arboretum of Ruhande and the National Tree Seed Centre in Huye (RFA) |

| Environmental | Economic and social |
|---|---|
| Soil erosion, landslides and siltation of rivers and dams | Scarcer and dearer firewood and charcoal |
| Lower dry-season river flows, more floods | Lost income from timber, honey and tourism |
| Loss of habitats and species | More time spent collecting fuel, often by women and children |
| Release of stored carbon; local climate change | Lower crop yields as soils are washed away |
Worked example 2: carbon released by clearing
Problem. If a forest holds about 135 tonnes of carbon per hectare (FAO, in REMA, 2021), how much carbon dioxide is released if 1,000 ha are cleared and all the carbon is emitted? (Each tonne of carbon forms tonnes of .)
Interpretation. Clearing just 1,000 ha could release about half a million tonnes of carbon dioxide. Not all carbon is released at once (some stays in soil and wood products), so this is an upper estimate, but it shows why forest protection counts in climate policy.
Warning
Net change hides gross change. "Forest cover increased" (net) can be true while 105,713 ha were cut (gross loss). When you evaluate deforestation, quote both the loss and the gain, and say what type of forest was lost.
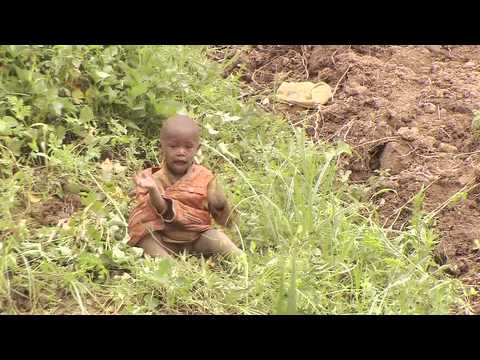
IUCN: "Rwanda: Back to the Garden". How deforestation and land degradation affected Rwanda's landscapes, and the restoration that followed. List the causes and effects of deforestation it shows.
Practice
Key points
Sources and credits
Sources: Rwanda State of Environment and Outlook Report 2021, REMA, citing the Ministry of Environment's 2019 forest mapping, RWFA (2017) and FAO (2020) (deforestation and afforestation by province, energy share, carbon stock, problems of plantations, fires); Rwanda State of Environment and Outlook Report, REMA, 2009 (mining in forests); GDP National Accounts, 2025, NISR (forestry value added); Upper Nyabarongo Catchment Plan 2018–2024, RWB ("water tower"); From Seeds to Security, Rwanda Forestry Authority, 3 April 2026 (National Tree Seed Centre).
Figure 4 and the worked examples were drawn and written by Ganzaa.
Photo: Deforestation and Global warming, Stevenndori289, CC BY-SA 4.0, via Wikimedia Commons.
Video: "Rwanda: Back to the Garden", IUCN, International Union for Conservation of Nature, embedded from YouTube. The rest of the lesson and the exercises were written by Ganzaa.
This lesson adapts CC BY-SA material and is shared under CC BY-SA 4.0.
Quick check
Which province lost more forest than it gained between 2009 and 2019?