Energy Changes and Energy Profile Diagrams for Chemical Reactions
Senior 4 · Chemistry
Energy Changes and Energy Profile Diagrams for Chemical Reactions
Lesson 4 of 4
30 min
Hydrogen peroxide decomposes exothermically into water and oxygen, releasing 98 kJ for every mole. Yet a bottle of dilute hydrogen peroxide from a pharmacy lasts for months. Add a little potassium iodide and the same liquid foams furiously, fast enough to push a column of foam out of a bottle. The reaction was always "downhill" in energy; what changed is the size of the hill that had to be climbed first. An energy profile diagram shows both: the overall energy change and the barrier in the way.

Definition
Energy profile diagram (reaction profile): a graph of the enthalpy (energy) of the reacting particles against the reaction coordinate, the progress of the reaction from reactants to products.
Activation energy, : the minimum energy that colliding particles must have for a reaction to occur; on the diagram, the height of the peak above the reactants.
Transition state (activated complex): the arrangement of atoms at the top of the energy barrier, in which old bonds are partly broken and new bonds partly formed. It cannot be isolated.
Catalyst: a substance that increases the rate of a reaction by providing an alternative route with a lower activation energy, and is chemically unchanged at the end.
Figure 17.4: Energy profile for , in kJ mol⁻¹, drawn to scale. ΔH from enthalpies of formation; activation energies from LibreTexts (data only).
Figure 17.5: Energy profile for , in kJ per mole of equation, drawn to scale. ΔH from enthalpies of formation; activation energies from Doc Brown's Chemistry (data only).
Reactions that happen in several steps have one hump for each step; the dips between humps are intermediates, which you will study with reaction mechanisms in Senior 6.
Worked example 1: reading a profile
Use Figure 17.4 to give (a) ΔH, (b) for the uncatalysed forward reaction, (c) for the reverse reaction with the catalyst present, and (d) the effect of iodide ions on ΔH.
Solution. (a) Products are 98.0 kJ below reactants: ΔH = −98.0 kJ mol⁻¹. (b) 75.3 kJ mol⁻¹. (c) The catalysed peak is 56.5 kJ above the reactants, so it is above the products. (d) None: the catalyst lowers both barriers by the same amount (18.8 kJ) but leaves the reactant and product levels where they are.
Worked example 2: from data to a diagram
For , . Without a catalyst ; on a tungsten catalyst it is about 162 kJ mol⁻¹ (Doc Brown's Chemistry). Find ΔH, describe the profile, and calculate for the reverse reaction on tungsten.
Solution. Exothermic: products 92.2 kJ below reactants; a tall hump 350 kJ above the reactants, and a lower catalysed hump 162 kJ above them. Reverse on tungsten: The very high uncatalysed barrier (the N≡N triple bond must be weakened) is why the Haber process needs an iron catalyst even though the reaction is exothermic.
Warning
Common mistakes. (1) Measuring from the zero of the axis or from the products: it is measured from the reactants to the peak. (2) Drawing a catalysed profile that ends at a different product level: a catalyst cannot change ΔH. (3) Confusing an enthalpy level diagram (start and end only) with an energy profile (which shows the barrier). (4) Thinking a large negative ΔH means a fast reaction: speed depends on , not on ΔH.
Safety. The elephant's toothpaste demonstration uses concentrated hydrogen peroxide (often 30%), which burns the skin and eyes, and the foam is hot: it is done only by a teacher, wearing gloves and goggles, on a tray, with students standing back. School practicals use dilute (3–6%) hydrogen peroxide.
Tip
"Ea from the start; ΔH from start to finish." Exothermic: finish lower. Endothermic: finish higher. Catalyst: lower hump, same start and finish. Reverse barrier = Ea − ΔH.
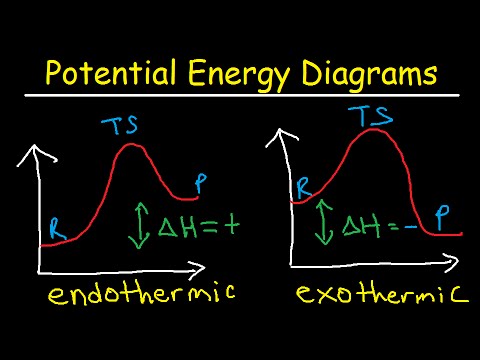
The Organic Chemistry Tutor: Potential Energy Diagrams, Catalyst, Endothermic and Exothermic Reactions (12 min). Watch how ΔH, activation energy and the effect of a catalyst are read from each diagram.
Practice
Key points
Further reading
Sources and credits
Quick check
On an energy profile diagram, how is the activation energy measured?