Population and Natural Resources
Senior 6 · Biology
Population and Natural Resources
Lesson 1 of 4
25 min
In August 2022, the National Institute of Statistics of Rwanda (NISR) counted every person in the country in the Fifth Population and Housing Census: 13 246 394 people. That is a census of a whole population. Ecologists rarely have that luxury: nobody can count every impala in Akagera or every grasshopper in a field of sorghum. Yet managing a park, a fishery or a pest needs to know how big a population is, whether it is growing, and how it is spread out.
This unit studies populations: what describes them, how they are measured, why they grow or shrink, and what limits them. It ends with the natural resources on which Rwanda's own population depends.
Definition
Population: all the organisms of one species living in one area at the same time, able to interbreed. Example: the impala of Akagera National Park.
Population size (): the number of individuals in the population.
Population density: the number of individuals per unit area (or volume), . Example: people per , or plants per .
Distribution (dispersion): the way individuals are spaced within the area: clumped, random or uniform.
Population structure: the proportions of individuals of each age and sex, shown in an age–sex pyramid.
Density lets you compare populations in areas of different sizes. Rwanda's population density rose from 183 people per in 1978 to 272 in 1991, 321 in 2002, 415 in 2012 and 503 in 2022 (NISR): among the highest in Africa. In ecology, density is often more useful than total size, because many factors that control a population, such as competition for food and the spread of disease, depend on how crowded it is (Lesson 3).
Figure 1 shows the three patterns of spacing.
Figure 1: The three patterns of distribution. The same number of individuals (36) is in each square.

A population pyramid shows the number of males and females in each age group. Its shape tells you how the population has grown in the past and how it is likely to grow. Figure 2 is drawn from NISR's 2022 census data for Rwanda.
Figure 2: Rwanda's population by age and sex, 2022. Data: NISR, Fifth Population and Housing Census, Table 5.
| Shape of pyramid | What it shows | Future growth |
|---|---|---|
| Broad base, narrow top (expanding) | High birth rate; many young people; fewer survive to old age | Fast growth: many people will soon reach reproductive age |
| Straight sides (stable) | Birth rate and death rate low and similar | Little or no growth |
| Narrow base (contracting) | Birth rate below replacement; an ageing population | Decline, unless people migrate in |
Worked example 1: analysing Rwanda's 2022 age structure
From the NISR census: 4 956 812 people were aged 0 to 14, 7 737 654 were aged 15 to 64, and 551 928 were aged 65 and over, out of 13 246 394. Calculate (a) the percentage aged under 15, (b) the dependency ratio, and (c) interpret the results.
Plants and slow-moving animals are sampled with quadrats (Unit 1, Lesson 2): .
Mobile animals move between quadrats, so ecologists use capture–mark–release–recapture:
The fraction of the second sample that is marked estimates the fraction of the whole population that is marked, . Rearranging gives the Lincoln–Petersen index:
The estimate is valid only if: marked and unmarked animals mix fully; the marks do not fall off, and do not make animals easier or harder to catch or to be eaten; no births, deaths, immigration or emigration happen between the samples; and both samples are taken in the same way.
Large mammals in open country are often counted from aircraft along transects, and forest animals are increasingly counted with camera traps that recognise individuals by their markings.

Worked example 2: tilapia in a fish pond
A fish farmer's cooperative wants to know how many Nile tilapia are in a pond before harvest (illustrative data). They net 60 fish, clip a small part of a fin on each, and release them. Four days later they net 50 fish, of which 12 have clipped fins. Estimate the population, and state two assumptions.
Reliability: if only 2 marked fish had been recaptured, the estimate would be , and one fish more or less would change it by hundreds. Large samples and several recaptures give a more reliable estimate.
Warning
Three common mistakes
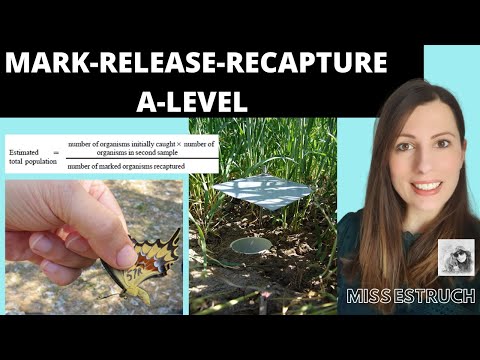
Miss Estruch Biology: "Mark-Release-Recapture A-level Biology". Watch for the method, the ethics of marking, the calculation and the assumptions, and compare them with Worked example 2.
Tip
Exam technique. For any population-size question, first decide: does the organism move? If not, use quadrats and scale up by area; if it does, use mark–release–recapture. Then always state at least two assumptions; they earn marks in almost every question on this method.
Practice: population characteristics and measurement
Key points
Sources and credits
Figures 1 and 2, the tables, the worked examples and the practice questions are written by Ganzaa. Figure 2 is drawn from the NISR census data; the data in Worked example 2 are illustrative.
This lesson adapts CC BY-SA material and is shared under CC BY-SA 4.0.