Production Theory
Senior 4 · Economics
Production Theory
Lesson 5 of 5
30 min
A furniture workshop in Kigali wins a contract for school desks. It can meet it by hiring more carpenters, by renting a power saw and planer, or by some mix of the two. Lesson 4 showed that many mixes can produce the same output. Which one should the workshop pick?
The answer depends on what each input costs. NISR's Labour Force Survey found that employees in Rwandan industry earned on average Frw 849 an hour in cash in 2025. If labour is cheap compared with machines, the workshop leans towards labour; if machines become cheaper, it leans towards capital. This lesson draws input prices as an isocost line and finds the cheapest mix.
Definition
Isocost line ("equal cost"): a line showing all the combinations of two inputs that a firm can buy for the same total cost, at given input prices:
where is total cost, the wage per unit of labour and the price per unit of capital (for example, the hire of a machine for an hour). The intercepts are on the labour axis and on the capital axis; the slope is .
Example: with , and , the firm can hire 24 worker-hours, or 6 machine-hours, or any mix on the line between them.
The isocost line does for a producer what the budget line did for a consumer in unit 5. It moves in the same way:
The workshop in lesson 4 produces . Suppose labour costs Frw 800 per worker-hour, close to NISR's 2025 average for industry, and a machine costs Frw 3,200 per hour to hire (illustrative). The order is 60 units. Here is the cost of each combination on the 60-unit isoquant:
| Combination (L, K) | (4, 9) | (6, 6) | (9, 4) | (12, 3) | (18, 2) | (24, 1.5) |
|---|---|---|---|---|---|---|
| Labour cost, | 3,200 | 4,800 | 7,200 | 9,600 | 14,400 | 19,200 |
| Capital cost, | 28,800 | 19,200 | 12,800 | 9,600 | 6,400 | 4,800 |
| Total cost, C (Frw) | 32,000 | 24,000 | 20,000 | 19,200 | 20,800 | 24,000 |
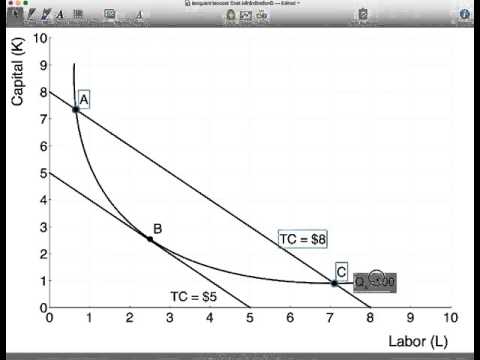
Reading the diagram. The firm wants the lowest isocost line that still reaches the 60-unit isoquant. Frw 14,400 cannot buy enough inputs. At A or B, Frw 24,000 is spent. At E the isocost line of Frw 19,200 just touches the isoquant: 12 worker-hours and 3 machine-hours, the cheapest way to make 60 units, as the table confirms.
Definition
Producer equilibrium (least-cost combination): the combination of inputs at which a firm produces a given output at the lowest possible cost, or, equivalently, the greatest output for a given cost. It is where an isoquant is tangent to an isocost line:
In words: the last franc spent on labour adds as much output as the last franc spent on capital.
Why must the "output per franc" be equal? If , a franc moved from capital to labour raises output, so the firm should hire more labour and less capital until the ratios are equal. This is the same equi-marginal reasoning a consumer uses, with output in place of utility.
Changes in input prices: factor substitution. If capital becomes cheaper, the isocost line becomes steeper ( rises) and the tangency moves to a point that uses more capital and less labour.
Reading the diagram. When machine hire falls from Frw 3,200 to Frw 1,800, rises from 0.25 to about 0.44. The cheapest way to make 60 units moves from E₁ (12, 3) to E₂ (9, 4), and the cost falls from Frw 19,200 to Frw 14,400. The firm substitutes capital for labour. This is why the relative price of labour and capital helps explain why some economies use hoes and others bulldozers.
The expansion path. If input prices stay fixed and the firm grows, it moves to the least-cost point on each higher isoquant. The line joining these points is the expansion path. For with , every least-cost point has , so the expansion path is a straight ray from the origin: (12, 3) for 60 units, (24, 6) for 120 units.
Worked example 1: finding the least-cost combination with algebra
For , lesson 4 showed that . With and , find the least-cost way to make 60 units.
Step 1: tangency. .
Step 2: output. , so .
Step 3: cost. francs.
Check with output per franc: at (12, 3), and . Then and . Equal ✔.
Worked example 2: is the firm using the right mix?
A maize mill hires labour at Frw 500 an hour and machine time at Frw 1,500 an hour. At its present mix, the marginal product of labour is 20 kg of flour an hour and that of machine time 40 kg.
Output per franc: labour kg; machine time kg.
Decision: labour gives more flour per franc, so the mill should use more labour and less machine time. As it does, falls and rises (diminishing returns) until .
Warning
The cheapest input is not always the best buy. A firm compares output per franc, , not prices alone and not marginal products alone. And the slope of the isocost is only when labour is on the horizontal axis.
Tip
Same picture, new names. Consumer: indifference curve + budget line, . Producer: isoquant + isocost line, . Learn one diagram and you have both.
Important
Discuss. Suppose that, as in many low-income countries, wages are low while machines are imported and the loans to buy them are expensive. Use the isocost line to explain why firms would choose labour-intensive methods. Is this choice always good for the country in the long run?
Guy Pascale, "Isoquant Isocost Cost Minimization". Watch for the comparison of points on a dearer isocost line with the single point on a cheaper one, and for the condition that, at the least-cost point, the ratio of marginal products equals the ratio of input prices.
Practice
Key points
Further reading
Sources and credits
Written by Ganzaa: the text, the isocost diagrams (drawn to scale from and the cost equations), the tables, the worked examples and the practice items. The machine-hire prices and the mill figures are illustrative.
Quick check